


0
US Dollar Index
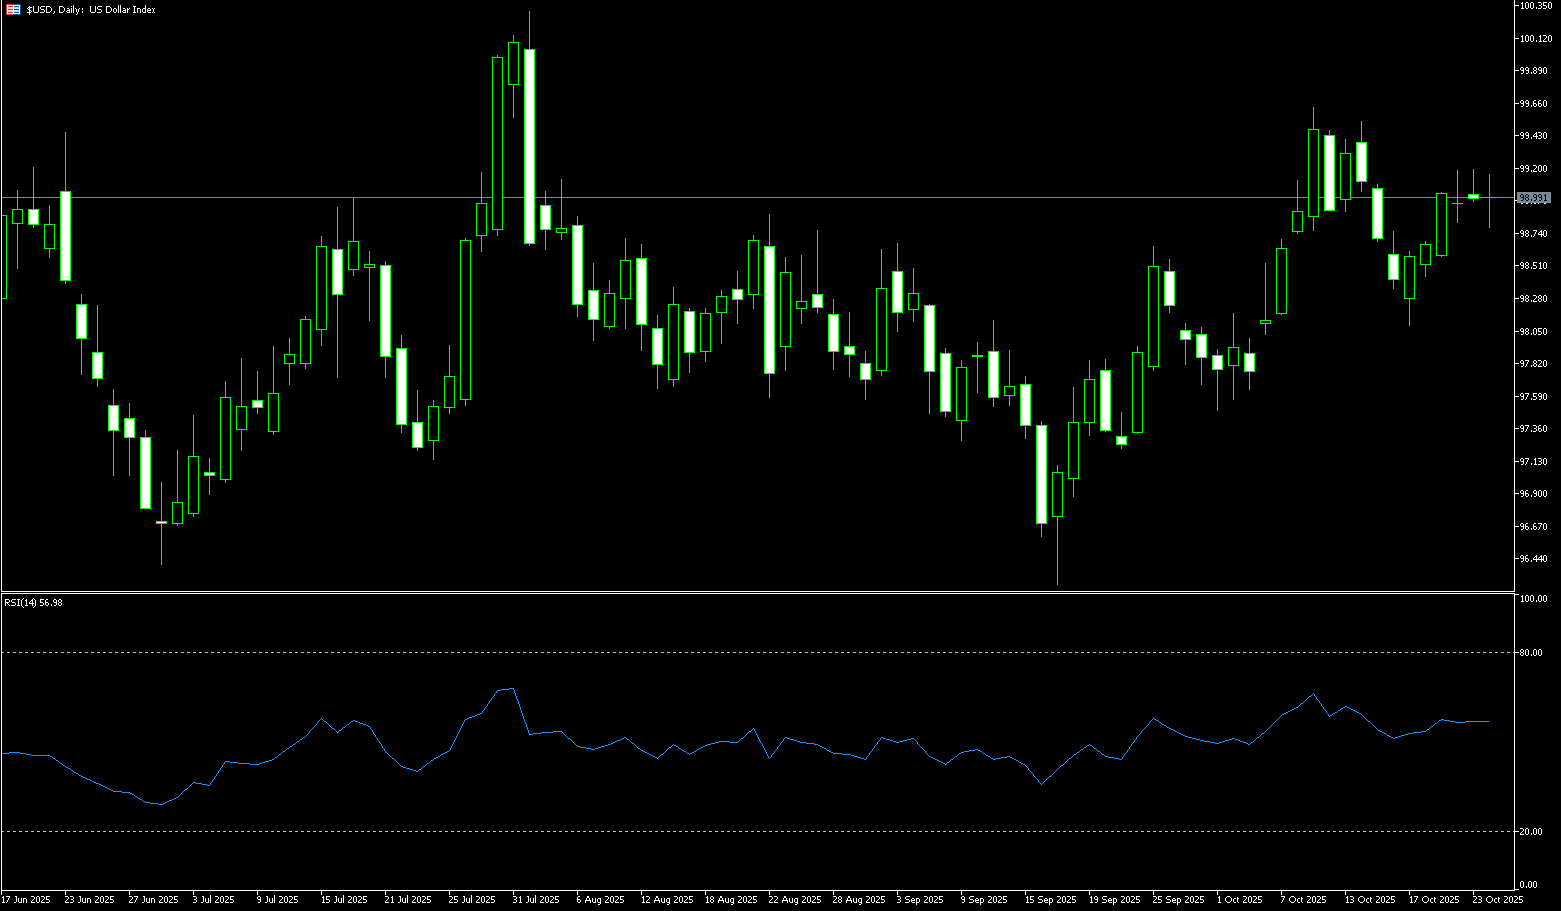
Before the end of last week, despite the release of weaker-than-expected US Consumer Price Index data for September, the US Dollar Index remained range-bound around 99.00. The dollar started the week on a solid note, though early momentum weakened as the week progressed. Despite this, the US Dollar Index managed to close slightly higher around 99.00, enough to erase the previous week's pullback and maintain its recovery from the 2025 low reached in mid-September. Currently, the US Dollar consolidated its gains before the weekend, trading within a 40-point range around 99.00. Its relatively restrained trading suggests traders are increasingly cautious ahead of next week's Federal Reserve meeting. The recent inflation data further fueled market expectations of a shift toward easing policy from the Fed. The focus remains on next week's Fed meeting, which is widely expected to conclude with a 25 basis point rate cut. However, an unexpected rise in inflation could reignite concerns about the risk of tariff-induced inflation, shake expectations of a December rate cut, and provide additional support for the US dollar. While technically, the index still has the potential to rebound above 99, short-term market sentiment is bearish—unless the Federal Reserve sends hawkish signals at next week's meeting, this bearish pattern is unlikely to change.
The daily chart shows the US dollar index trading between the Bollinger Bands' middle line (98.56) and the upper line (99.58), indicating a "slightly strong consolidation above the middle line." The MACD momentum is positive but limited, suggesting a "modest bullish trend rather than an accelerated uptrend." The 14-day RSI is at 57.05, in the bullish zone "just below the slightly overbought level," indicating that trend and structural divergences have yet to materialize. At this stage, in the absence of new catalysts, a two-way trade is possible. Short-term resistance lies at 99.58 (the upper Bollinger Band) and 99.56 (the near two-month high). A break below this level could lead to the psychologically important 100.00 level. As for support, the first support level to watch is 98.71 (the 61.8% Fibonacci retracement level from 100.26 to 96.22), followed by 98.24 (the 50.0% Fibonacci retracement level). A break below this level could lead to a further pullback to lower support at 98.13 (the 50-day simple moving average) and 98.00 (the round number level).
Consider shorting the US dollar index at 99.06 today, with a stop-loss at 99.18 and targets at 98.50 and 98.60.
WTI Spot Crude Oil
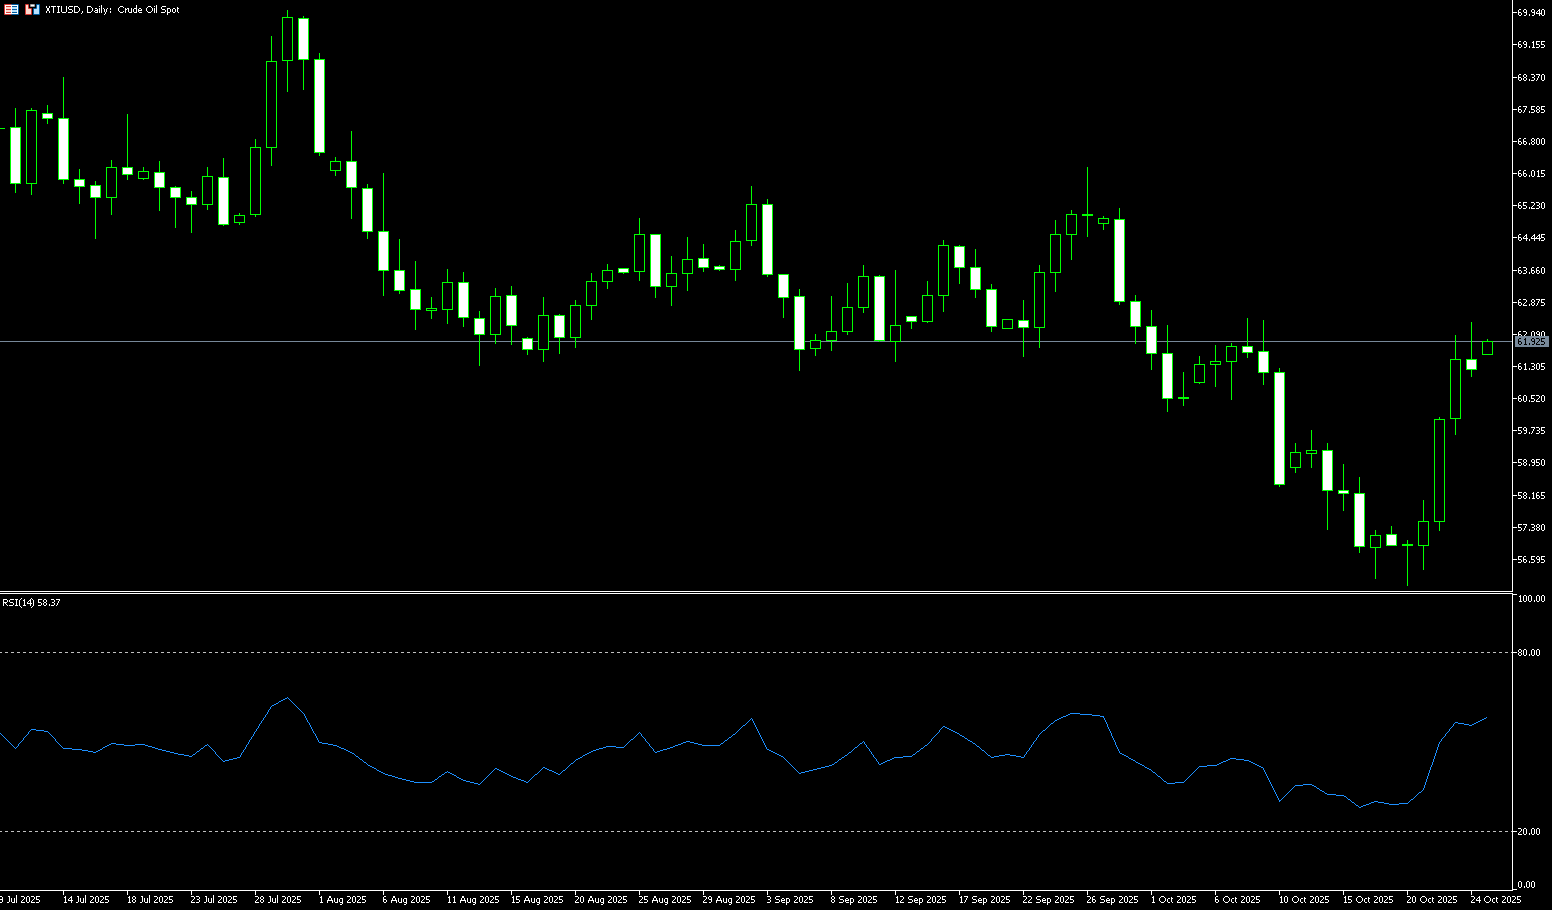
WTI crude oil traded above $61 a barrel last Friday, near a two-week high and posting its strongest weekly gain of about 7% since early June, as new U.S. sanctions on major Russian producers sparked supply concerns. Washington blacklisted state-owned oil giants Rosneft and Lukoil to pressure Moscow to respond to the war in Ukraine. The two companies account for nearly half of Russia's oil exports and are crucial to the Kremlin's budget. Following the sanctions, there were reports that Chinese state-owned oil companies had halted seaborne purchases of Russian crude oil, while Indian refiners planned to significantly cut imports to comply with the measures. Meanwhile, the European Union imposed new sanctions targeting Russian energy infrastructure, and Ukrainian forces continued to carry out strikes against refineries, pipelines, and export terminals. Kyiv said it attacked a Rosneft refinery on Thursday. If the next two weeks of Sino-U.S. tariff talks yield positive signals, oil prices could see a temporary correction before the end of the year, but the overall trend remains moderately downward.
From a technical perspective, crude oil prices rose sharply last week. The rebound has shifted the short-term outlook from bearish to neutral to bullish. Momentum indicators have shown positive signals: the 14-day relative strength index (RSI), a technical indicator on the daily chart, has rebounded from near oversold territory to above the 55.00 midline, indicating that bullish momentum is strengthening; while the MACD, although in negative territory, has shown an upward trend, indicating that the bullish trend is strengthening, but has not yet formed a fully established upward trend. Therefore, on the upside, the initial resistance for US crude oil is at 62.68 (65-day simple moving average) - $62.44 (October 9 high). If the price breaks through and holds above this resistance range, the next resistance level will be at $64.19, the 100-day simple moving average. Although this key moving average indicator has temporarily suppressed the upside, a strong break above this resistance level on the daily chart will confirm that the bulls have regained control and pave the way for a test of the next key resistance levels of $65.19 (September 29 high) and $65.21 (200-day simple moving average). On the downside, initial support is at $60.00 (market psychological level); The market is near Thursday's low of $59.65. Subsequent support is expected to be at $58.60 (9-day simple moving average) and $58.00 (round number mark).
Today, consider going long on crude oil at $61.13. Stop loss: $61.00, target: $62.50, $62.70.
Spot Gold
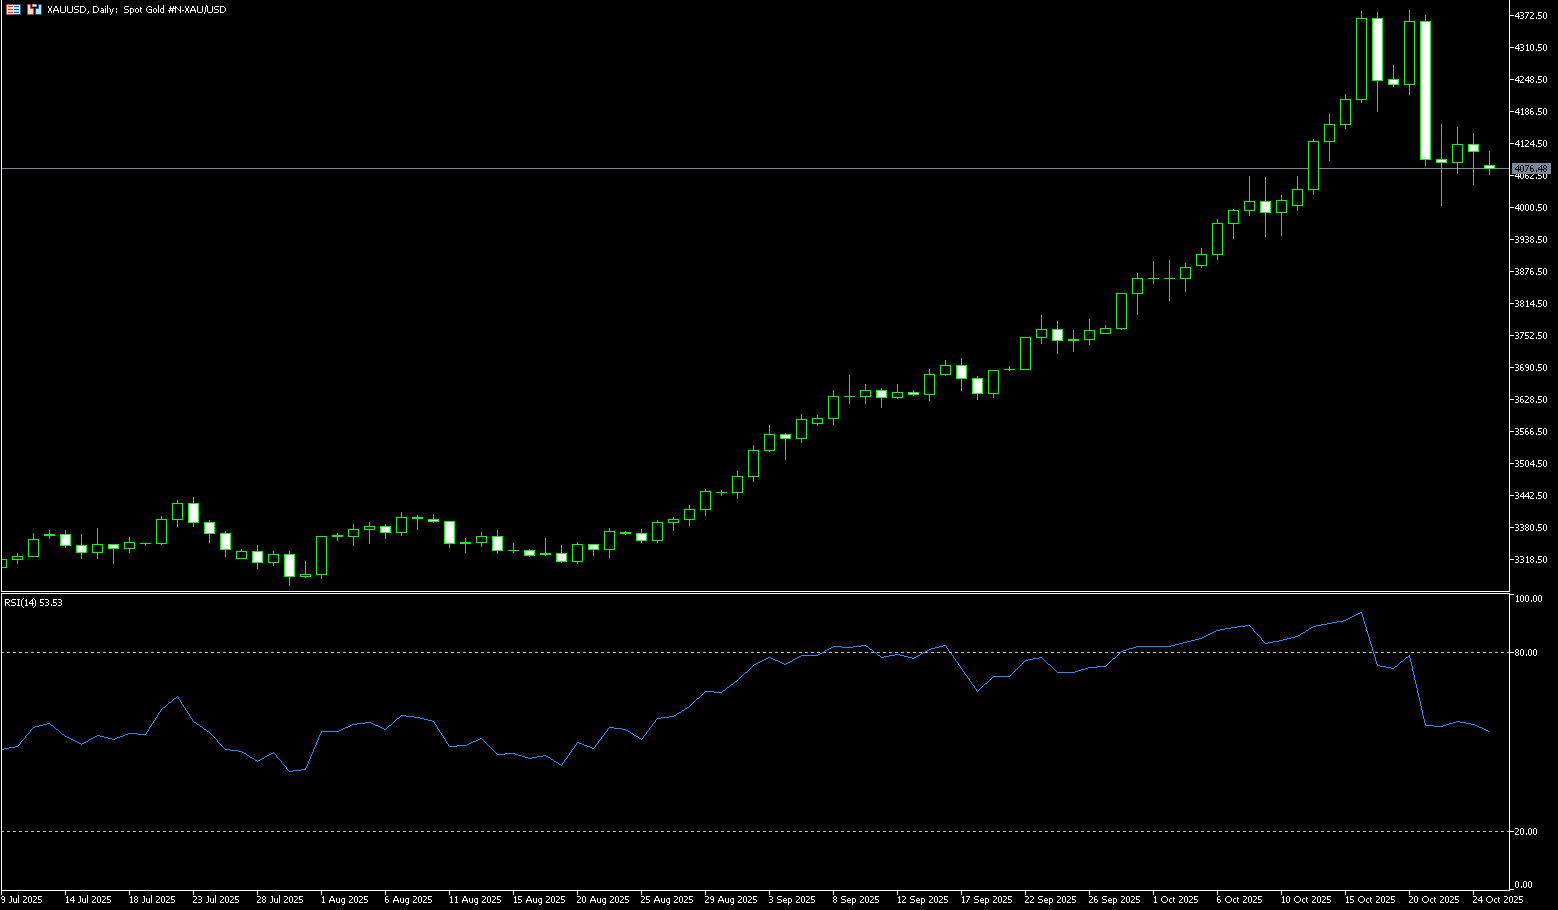
Gold prices fell to around $4,000 per ounce last week, a drop of more than 5% and the largest intraday drop in five years. Gold ended its nine-week rally, rebounding to around $4,100 before the weekend. It came under heavy selling pressure after hitting record highs several times over the past few trading days last week. The decline coincided with significant outflows from gold-backed ETFs, which saw their largest single-day drop in holdings in tons in five months. Despite this, gold is still up about 55% year-to-date, supported by ongoing trade tensions, with focus on trade negotiations between President Trump and President Xi at the end of this month. Geopolitical risks remain after the United States imposed new sanctions on Russia in an effort to pressure Moscow into a ceasefire agreement in Ukraine. Meanwhile, geopolitical factors have been a significant driver of gold price fluctuations. The Trump administration imposed sanctions on Russian oil giants Lukoil and Rosneft in response to issues related to the Ukrainian war, a move that reignited market demand for safe-haven assets. The sanctions have not only exacerbated tensions in the global energy market, but have also indirectly boosted gold's appeal as a hedge against geopolitical risks. In addition, Market expectations that the Federal Reserve may cut interest rates twice more before the end of the year continue to support gold bullion.
Despite the positive outlook, gold is not a risk-free asset. If the Fed's rate cut path deviates from expectations or the US dollar remains strong, gold could face a pullback. From a technical perspective, gold's upward trend briefly resumed in late last week, but buyers have yet to break through midweek's $4,186.60 level, the neckline of a "double top" pattern at $4,380 and $4,391. However, the Relative Strength Index (RSI) remains in positive territory, indicating that buying momentum is building. A breakout above $4,186.60 and $4,200 (round-number levels) would open up potential for gains towards $4,250 and $4,300. Furthermore, before the weekend, The 5-day moving average at $4,163.50 and the 9-day moving average at $4,194.20 form a bearish "death cross" pattern. If gold prices fall back, the first support level is the psychological level of $4,000, followed by the 30-day simple moving average at $3,941.70. A break below this level could lead to a test of the $3,900 mark. Furthermore, be wary of speculative market shakeouts, such as last week's sharp fluctuations aimed at clearing out weak bulls.
Consider going long on gold at 4,107 today, with a stop loss at 4,100 and targets at 4,160 or 4.150.
AUD/USD
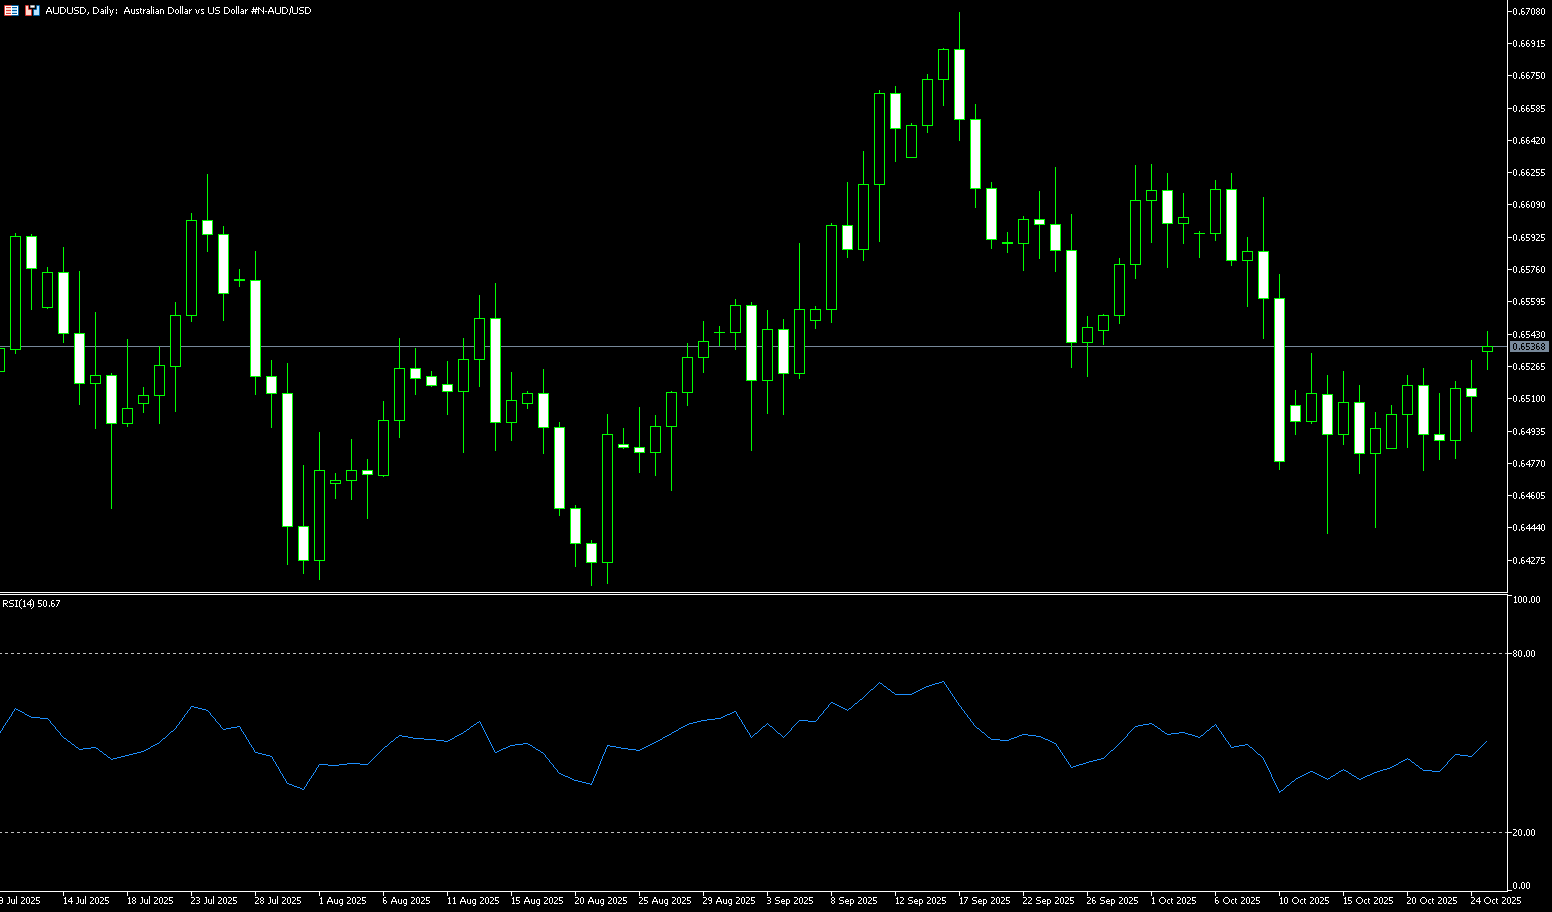
AUD remains at 0.6472. The dollar is currently trading around $0.6510, consolidating within a narrow range of $0.6529. Investors are preparing for key quarterly inflation data next week, which could impact the Reserve Bank of Australia's policy outlook. Markets expect the headline CPI to rise to 3.0% annually, at the upper limit of the RBA's 2-3% target, while core CPI is expected to remain stable. Last week, an unexpected rise in the unemployment rate in September led markets to price in a 25 basis point rate cut probability of around 70%, up from 40% previously. The RBA may face challenges as markets are betting on the Reserve Bank of Australia (RBA) Bets on a near-term interest rate cut are growing. Australia's latest jobs report surprised on the upside, with employment continuing to climb to its highest level in nearly four years in September. This unexpected rise has pushed the market's probability of a 25 basis point rate cut to 74%, a significant increase from the previous probability of around 50%. Investors also weighed flash PMI data, which showed that Australian factory activity contracted for the first time this year, while services sector growth accelerated in October. The Australian dollar remains on track for a modest weekly gain, fueled by signs of improving global trade relations, including the recently signed US-Australia critical minerals agreement.
AUD/USD held steady at 0.6472 last week. - The AUD/USD pair has been trading within a narrow range of $0.6529 and is currently consolidating around $0.6510. Technical analysis on the daily chart suggests a persistent bearish bias, with the pair trading within a descending channel. Last week, the 14-day (0.6514) and 100-day (0.6535) simple moving averages formed a bearish "death cross" pattern. Furthermore, the 14-day relative strength index (RSI) retreated to around 45.00, further strengthening the bearish outlook. On the downside, AUD/USD could trade around the 0.6443 (October 17 low) and 0.6435 (200-day simple moving average), followed by the April low of $0.6414 and the 0.6400 (round number). A break below this support confluence would strengthen the bearish bias and push the pair towards a test of the May low of $0.6372. On the other hand, AUD/USD is currently hovering near the 0.6500 level. A successful break above this level would improve short-term momentum and support a test of the 50-day simple moving average at 0.6550. A break below this level would target the 0.6570 (34-day simple moving average) and the 0.6600 (psychologically significant) area.
Consider a long position on the Australian dollar at 0.6500 today, with a stop-loss at 0.6490 and a target at 0.6550. 0.6560
GBP/USD
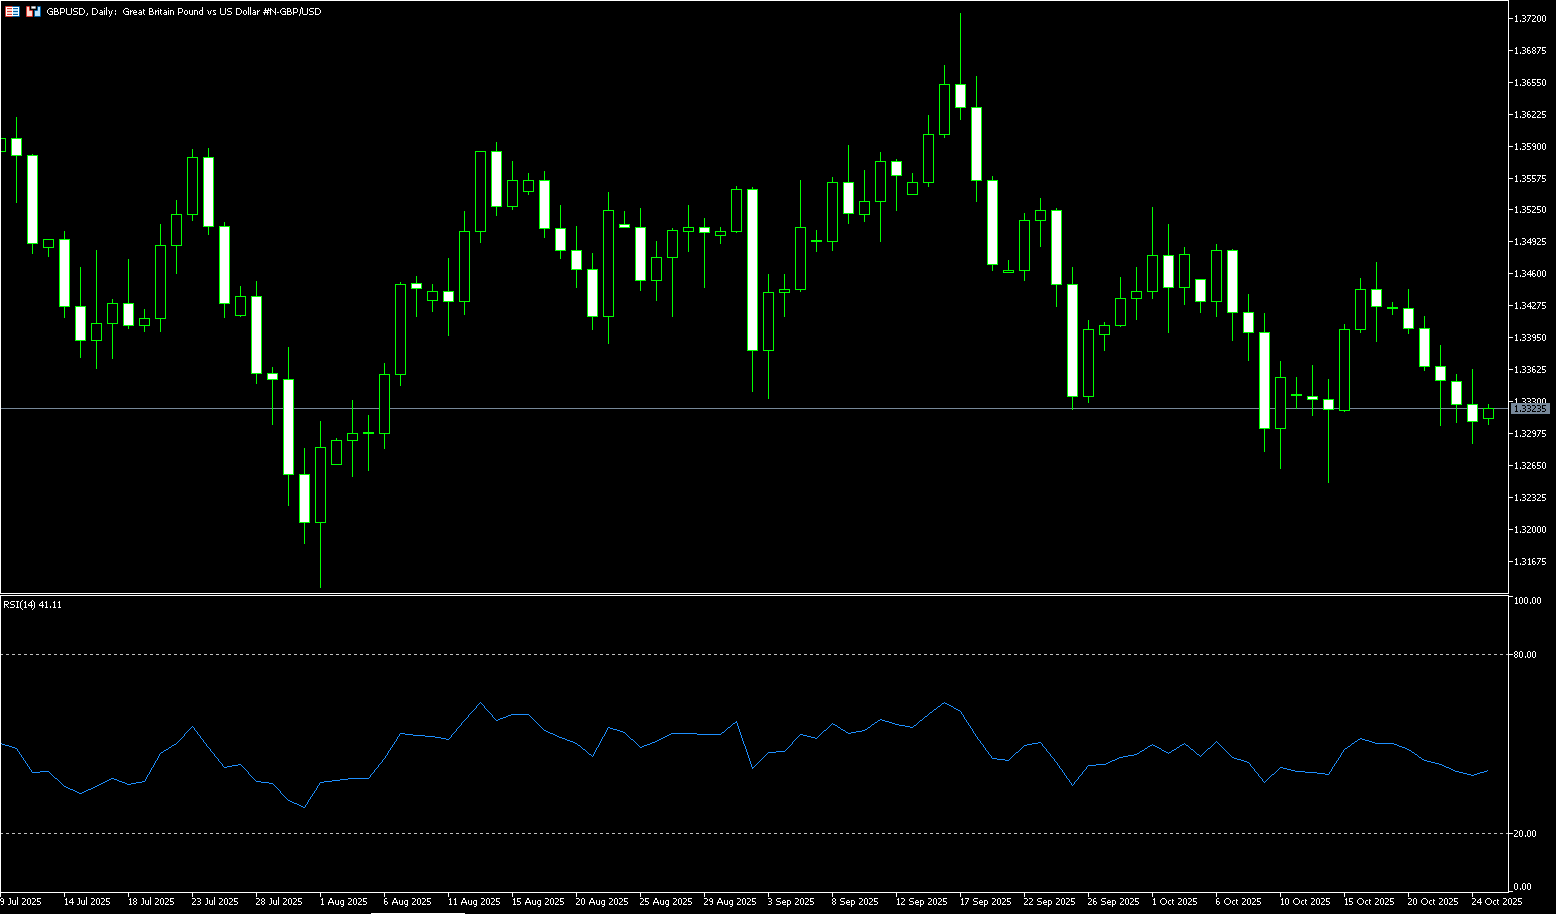
The British pound extended its decline against the US dollar to $1.3300, having earlier fallen to a one-week low of $1.3285 after weaker-than-expected inflation data fueled speculation that the Bank of England might cut interest rates sooner than expected. Headline inflation remained at 3.8% in September, defying expectations of a rise to 4%, with food price growth continuing to slow. Meanwhile, core inflation fell from 3.6% to 3.5%, also below expectations of 3.7%. These weaker figures provided some relief to Chancellor of the Exchequer Rachel Reeves, who recently stated plans to announce "a range of policies" in her November 26 budget aimed at "reducing some of the costs people face." However, government borrowing totaled £99.8 billion in the first half of this fiscal year, £7.2 billion higher than the OBR's forecast. Looking ahead, markets anticipate the Bank of England may begin cutting interest rates early next year, as inflation is expected to continue to moderate and labor market data shows signs of further cooling.
GBP/USD fell for six consecutive trading days last week and is currently trading just above $1.3300. Earlier, it fell to a one-week low of 1.3285. On the daily chart, GBP/USD is currently trading below its 20-day simple moving average at 1.3396, showing little change on the week. Technically, the pair is weak, holding below a pair of descending moving averages: the 20-day SMA at 1.3396 and the 50-day SMA at 1.3459. This bearish alignment places a short-term downward bias. Momentum indicators also reinforce this cautious tone, with the 14-day Relative Strength Index (RSI) dropping to 39.55, still below its 50-day midline, suggesting sellers maintain their advantage but not yet entering oversold territory. Initial resistance for GBP/USD is centered around 1.3360 (the 23.6% Fibonacci retracement level from 1.3726 to 1.3248), followed by the 1.3400 round-number mark and the 20-day SMA at 1.3397. A break below this level would target the 50-day simple moving average at 1.3459. On the downside, the first support level is 1.3248 (the October 14 low). The next support level is 1.3226 (the 200-day simple moving average), followed by the 1.3200 round-figure level.
Consider a long GBP at 1.3300 today, with a stop loss at 1.3288 and a target at 1.3350. 1.3360
USD/JPY
Amidst the volatile global economy, the Bank of Japan (BoJ) is poised for a highly anticipated interest rate meeting on October 30th. This meeting will not only determine Japan's short-term monetary policy direction but also potentially stir new waves in global financial markets. With the threat of US tariffs gradually fading, yen exchange rate volatility increasing, and domestic political dynamics shifting, will the BoJ raise interest rates? When will this be? These questions are undoubtedly weighing on market nerves. Recent data suggests that the Japanese economy has shown some resilience. Exports grew in September, business confidence improved significantly in the third quarter, and many companies maintained optimistic capital expenditure plans. These positive signs suggest that the potential threat of higher US tariffs has not had a significant impact on the Japanese economy. Signs of economic recovery provide the BoJ with confidence to raise interest rates, especially as inflationary pressures gradually emerge, and conditions appear to be ripening for resuming rate hikes. Meanwhile, US President Trump plans to visit Tokyo next week with Treasury Secretary Bensant, and has repeatedly expressed his desire for a stronger yen and a tighter monetary policy in Japan. This has undoubtedly added new external pressure to the BoJ's decision.
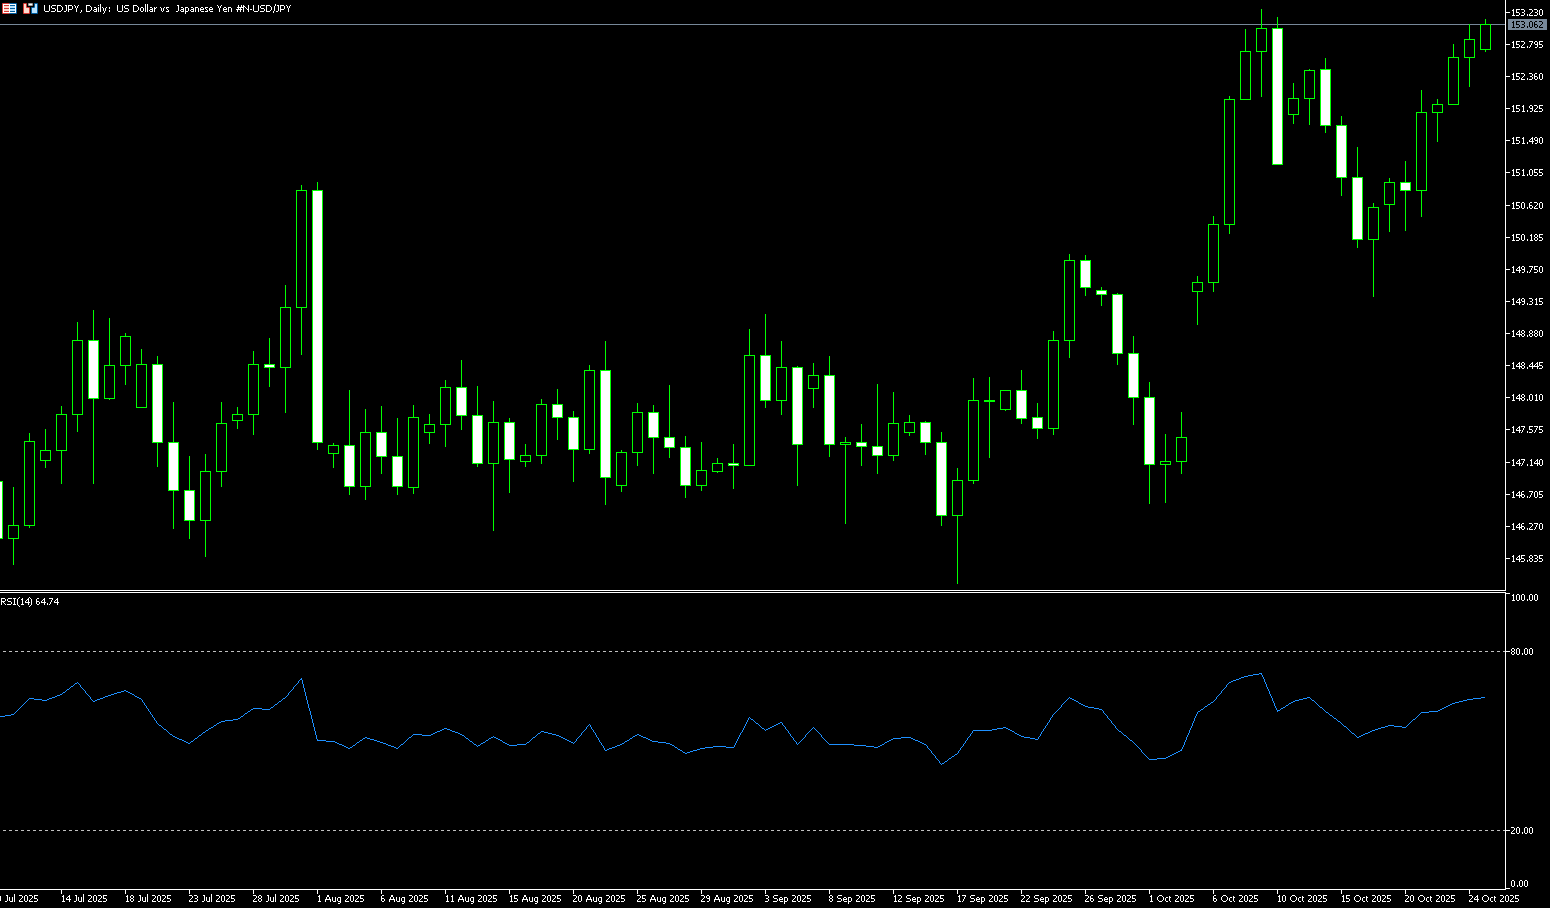
The USD/JPY pair surged to a four-day high. Investors now appear confident that Bank of Japan Governor Haruhiko Kuroda will announce further easing policies, which in turn could lead the Bank of Japan to postpone further rate hikes. This move, in turn, is weighing heavily on the yen as safe-haven demand is fading. Looking at the daily chart, the 89-day simple moving average (148.03) crossed above the 200-day simple moving average (147.81) last week, forming a bullish "golden cross." The 14-day relative strength index (RSI) has risen back above 60, indicating strengthening upward momentum. The USD/JPY pair hit a near two-week high of 153.06 last week and is poised to re-test the October 10 high of 153.27, considered a key trigger point for USD/JPY bulls. However, the subsequent advance encountered resistance near the February 13 high of 154.67. The 155.00 round number is a key support level, a break of which could pave the way for further gains. On the other hand, a breakout from previous converging resistance near 151.63 (10-day SMA) - 151.70 (23.6% Fibonacci retracement from 146.60 to 153.27) appears to be limiting immediate downside, ahead of 150.69 (20-day SMA). A break below the latter could drag USD/JPY down to the psychological 150.00 level.
Consider shorting USD at 153.05 today. Stop-loss: 153.25. Target: 152.00, 151.80.
EUR/USD
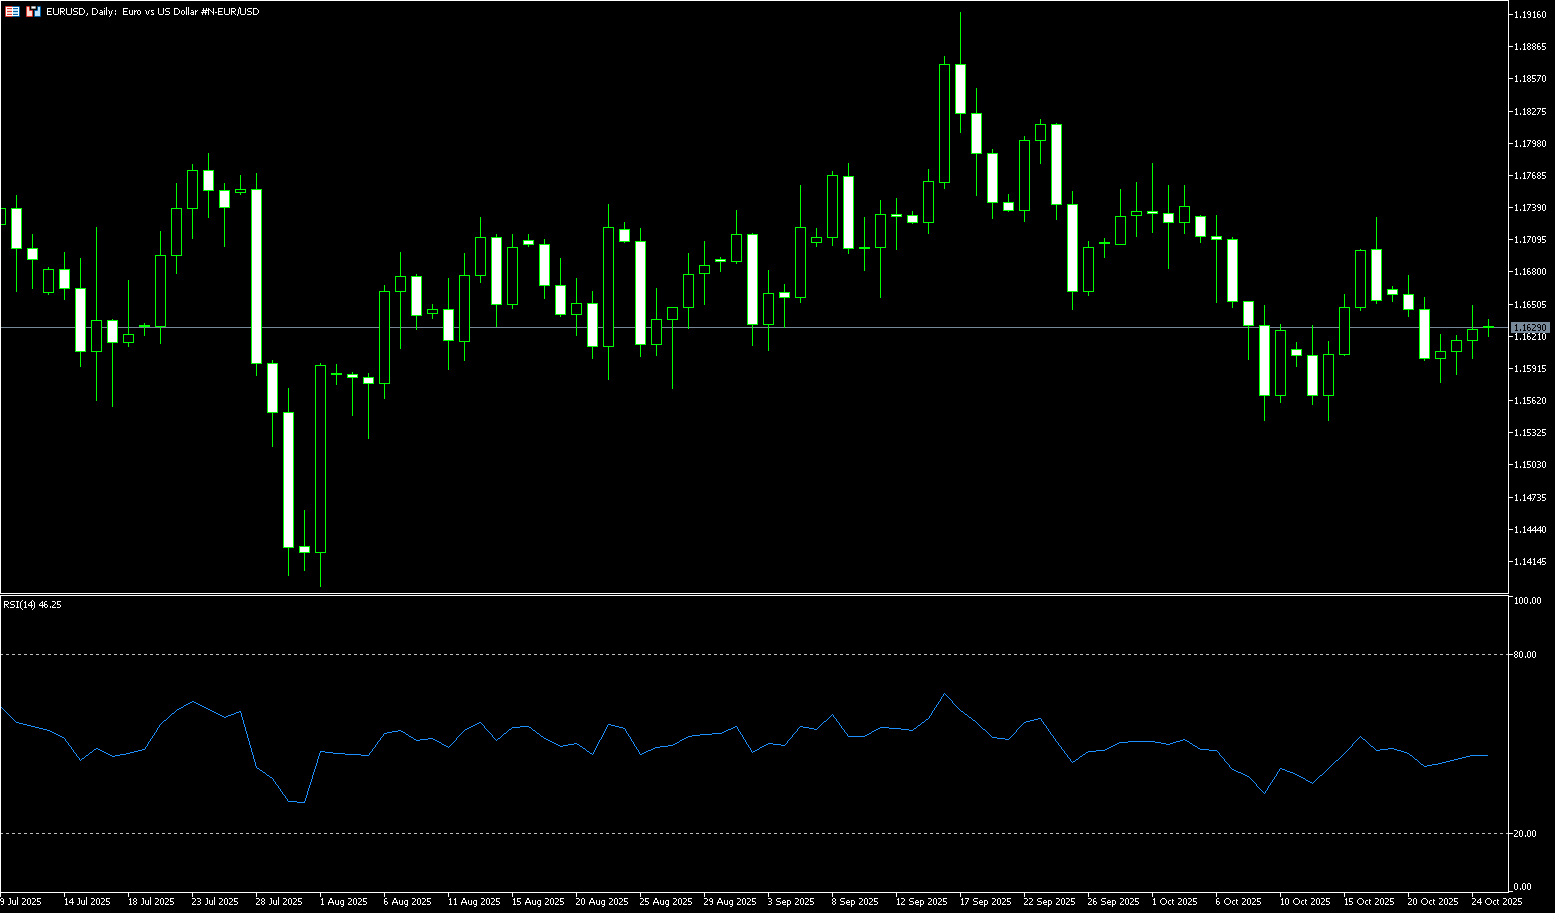
Despite upbeat German and Eurozone business activity data released last week, EUR/USD remains trading within its previous range, finding support above 1.1600. Eurozone HCOB Purchasing Managers' Index (PMI) data showed an unexpected expansion in manufacturing activity in October, with stronger-than-expected growth in the services sector, indicating the strongest activity in the past 12 months. These data improved the outlook for the Eurozone economy and bolstered the European Central Bank's (ECB) hawkish stance, dampening hopes for further monetary easing in the coming months. Trade issues remained a focus on Friday, with President Trump again igniting friction, this time with Canada, by posting a message on social media assuring that trade talks with its northern neighbor were "off," apparently in response to an advertisement featuring negative comments about tariffs by former US President Ronald Reagan. However, the US dollar remained range-bound, having gradually risen last week as renewed trade tensions kept risk appetite low this week. Investors remain focused on the decisions of the Trump-Xi meeting and the Federal Reserve's monetary policy next week.
On the daily chart, EUR/USD is currently trading around 1.1625, with minimal weekly fluctuations, trading within a narrow range between 1.1675 and 1.1576. The bearish 20-day SMA (1.1654) has slipped below the 100-day SMA (1.1659), forming a bearish "death cross" pattern. Meanwhile, the 14-day RSI (Relative Strength Index) is at 46.30, just below the neutral 50 line, indicating that sellers are attempting to gain control in the short term, suggesting further declines are possible. Consistent with the prevailing bearish momentum, immediate resistance lies at the 20-day SMA (1.1654) and the 100-day SMA (1.1660). A break below this level would target the 1.1700 level, followed by the October 1 high of 1.1780, and ultimately the 1.1800 level. Initial support lies at last week's low of 1.1576. A break below these levels would open the door to the 150-day SMA (1.1520) and further towards the 1.1500 level.
Today, consider going long on the Euro at 1.1615. Stop loss: 1.1602. Target: 1.1660; 1.1670.
Disclaimer: The information contained herein (1) is proprietary to BCR and/or its content providers; (2) may not be copied or distributed; (3) is not warranted to be accurate, complete or timely; and, (4) does not constitute advice or a recommendation by BCR or its content providers in respect of the investment in financial instruments. Neither BCR or its content providers are responsible for any damages or losses arising from any use of this information. Past performance is no guarantee of future results.
More Coverage


Risk Disclosure:Derivatives are traded over-the-counter on margin, which means they carry a high level of risk and there is a possibility you could lose all of your investment. These products are not suitable for all investors. Please ensure you fully understand the risks and carefully consider your financial situation and trading experience before trading. Seek independent financial advice if necessary before opening an account with BCR.

 English
 简体中文
简体中文
 繁體中文
繁體中文
 Bahasa
Melayu
Bahasa
Melayu
 Tiếng
Việt
Tiếng
Việt
 ไทย
ไทย
 日本語
日本語
 한국어
한국어
 ភាសាខ្មែរ
 español