

0
Currency & Commodity Analysis:
US Dollar Index
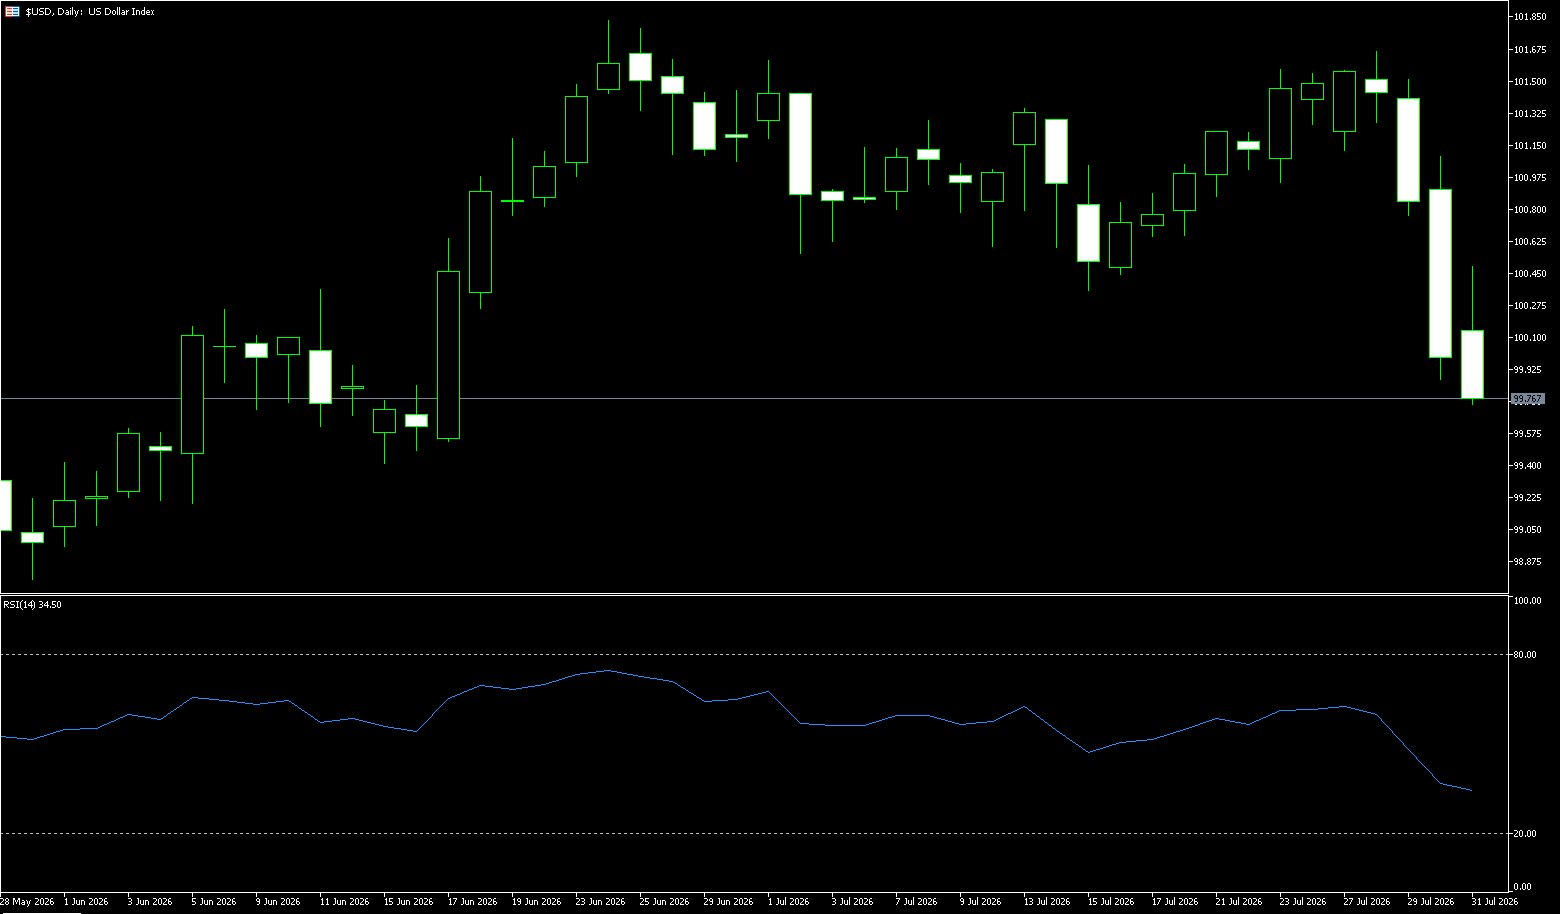
The US Dollar Index tracks the dollar's performance against a basket of currencies. On Thursday, it maintained a negative bias for the third consecutive trading day, hovering around the 99.65 area. The index remained near its lowest level since June 17, reached on Monday, as traders awaited further developments in the Middle East crisis and the release of key U.S. monthly jobs data on Friday. Iranian Foreign Ministry spokesman Esmail Bagaei stated that Iran and Oman were close to finalizing a proposed framework for commercial shipping through the Strait of Hormuz. This further boosted optimism about a diplomatic end to the five-month-long U.S.-Iran war, which, along with cooling expectations for a Federal Reserve interest rate hike, weakened the safe-haven dollar. Traders may also choose to wait for Friday's highly anticipated U.S. non-farm payrolls report for new clues about the Fed's future policy path and to assess the short-term trend of the dollar index. Furthermore, a series of geopolitical developments could continue to inject volatility into global financial markets and create some short-term trading opportunities around the dollar.
Faced with the current complex and mixed market conditions, most traders chose to remain on the sidelines, awaiting Friday's release of the U.S. monthly non-farm payrolls report. This crucial data will provide the market with a new overview of the health of the U.S. job market and directly impact the Fed's assessment of its future policy path. On the daily chart, the US Dollar Index is currently trading at 99.85, maintaining a short-term bearish bias below the 50-day simple moving average at 100.55 and the psychological level of 100.00. The distance from this simple moving average suggests the index is still trading at the lower end of its recent range, and the previous rebound failed to regain the medium-term trend indicator. A retest of these resistance levels is needed to alleviate the current downward pressure. On the downside, watch for 99.42 (this week's low) and the 99.00 (psychological level).
Consider shorting the US Dollar Index today at 100.06, with a stop-loss at 100.18 and targets at 99.60 and 99.50.
WTI Crude Oil
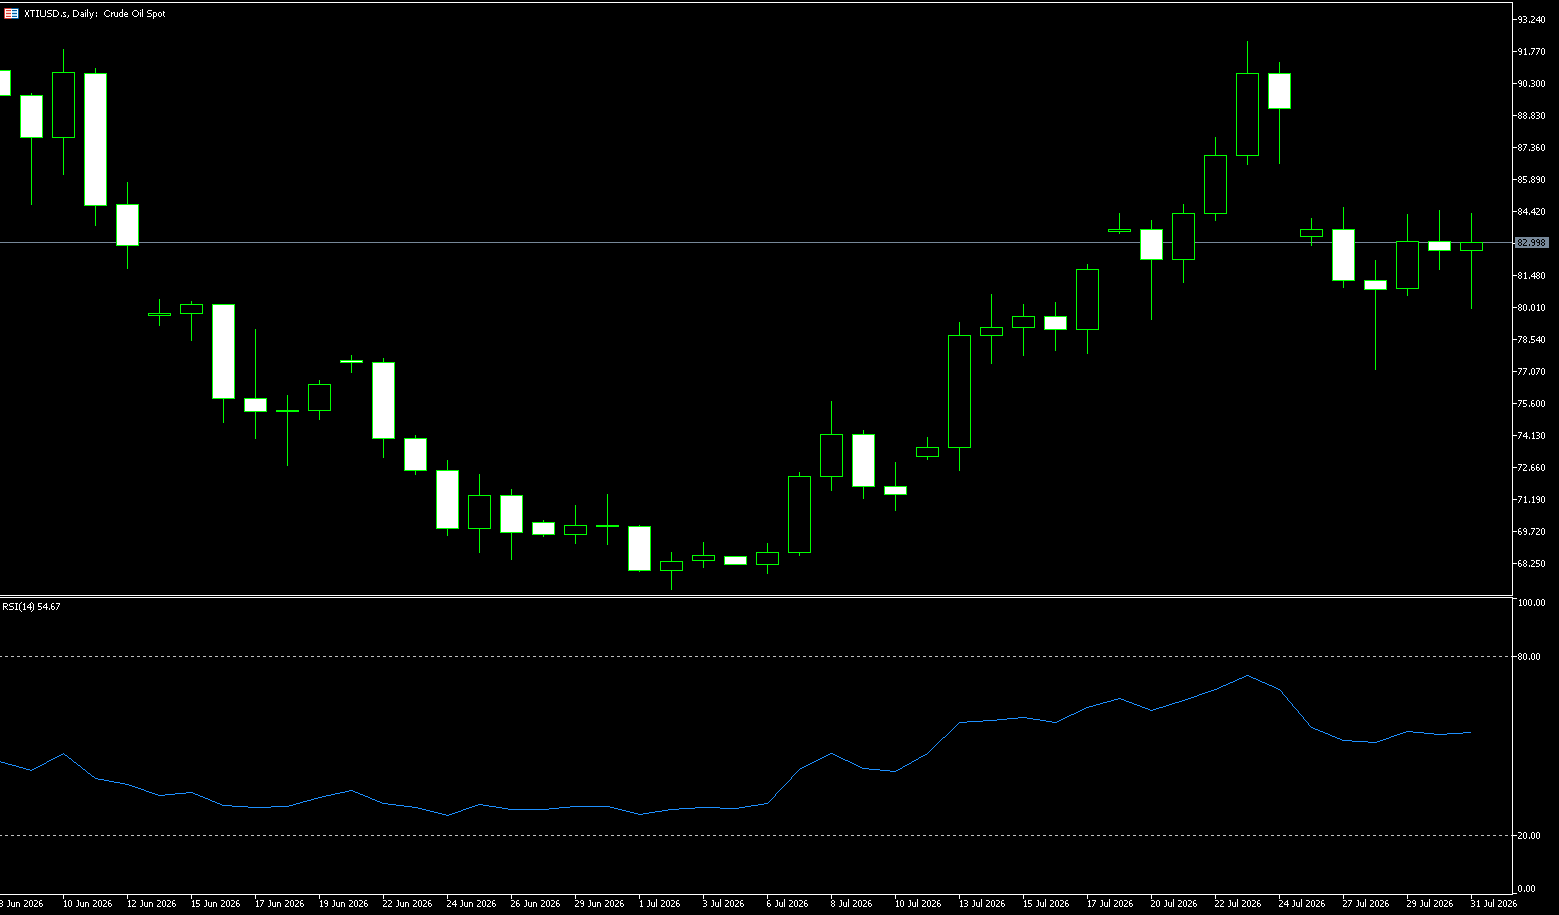
On Thursday, crude oil prices traded around $77 a barrel as Iran and Oman reached an agreement on a shipping route through the Strait of Hormuz, reinforcing expectations of increased energy flows through the Middle East. The joint statement from the two countries is currently under review and in its final drafting stage, with the proposed route expected to remain operational for two to four months, although Tehran emphasized that the agreement does not signify a full reopening of the strategic waterway. Meanwhile, US officials continued to express confidence in reaching an agreement with Iran, although investors remained cautious about the durability of any lasting peace in the region. The Iranian-backed Houthi rebels in Yemen claimed responsibility for targeting a Saudi oil tanker in the Gulf of Aden and threatened other vessels in the Red Sea, highlighting the ongoing risks to regional shipping.
Houthi attacks in the Red Sea and the suspension of the Caspian Pipeline Alliance serve as a constant reminder that geopolitical risks have not disappeared. Oil prices are fluctuating between "diplomatic optimism" and "real risks," and this high volatility is expected to continue in the short term. The actual navigation status of the Strait of Hormuz will be the core pricing variable for the market. The market is closely watching the situation in the Middle East, and any related announcements could influence the short-term direction of oil prices. If the agreement is widely accepted, oil prices may further decline to seek support at $75.45 (200-day moving average) and $70.00 (psychological level). If resistance is encountered at $78.91 (25-day moving average) and $80.00 (psychological level), or if certain conditions are met, it could provide short-term rebound momentum. Against the backdrop of fluctuating geopolitical signals, the high volatility of oil prices is expected to continue. The actual content of the Hormuz agreement and global reactions will be key variables determining the next direction of oil prices.
Today, consider going long on crude oil at 77.20, with a stop loss at 77.00 and targets at 78.80 and 80.00.
Spot Gold
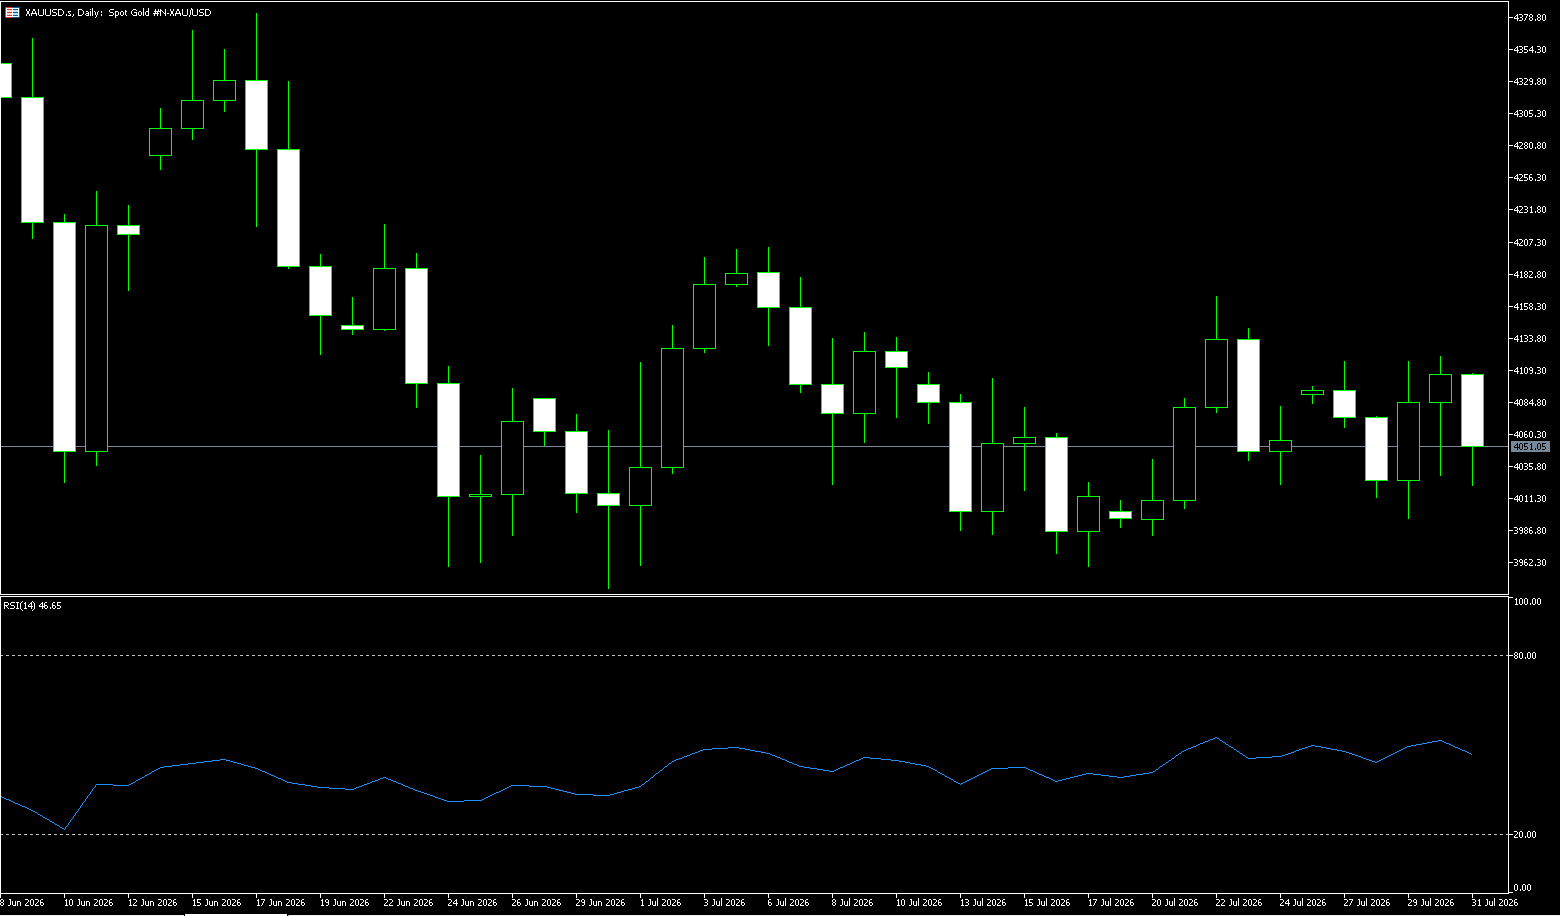
Gold rose to $4,300 an ounce on Thursday, marking its fourth consecutive day of gains and a nearly 6% increase so far this week, as an agreement to partially reopen the Strait of Hormuz lowered oil prices and eased concerns about inflation and interest rate prospects. An agreement between Iran and Oman for a shipping corridor through the strait boosted expectations of increased energy flows through the Middle East. Markets lowered their expectations for a Fed rate hike this year, now anticipating only one hike, compared to two hikes expected last week. Meanwhile, ADP data showed the U.S. economy added only 44,000 private sector jobs in July, the weakest reading since January and well below the expected 70,000. Elsewhere, Federal Reserve Governor Lisa Cook reiterated on Wednesday that she is prepared to raise interest rates if inflation fails to cool, warning that central banks may not have the luxury of waiting and must act before restoring inflation to their 2% target.
Overnight, gold prices broke strongly above the 50-day simple moving average of $4,157 and $4,166 (the July 22 high) for the first time since March 17, seen as a new trigger for gold/dollar bulls. Furthermore, a strengthening MACD histogram and a Relative Strength Index (RSI) of 61.82 suggest improving bullish momentum on the daily chart. However, before positioning for further gains, caution is advised, awaiting some follow-through buying after gold breaks above the 23.6% Fibonacci retracement level of the March-June decline. Subsequently, gold may attempt to challenge $4,382 (the June 17 high) and the psychological level of $4,400. On the downside, the 50-day simple moving average is providing immediate support at $4,157, while a further pullback could target the lower area near the psychological level of $4,100, which could form a more significant structural bottom.
Consider going long on gold today at $4,235, with a stop loss at $4,230; targets: $4,285; $4,300.
AUD/USD
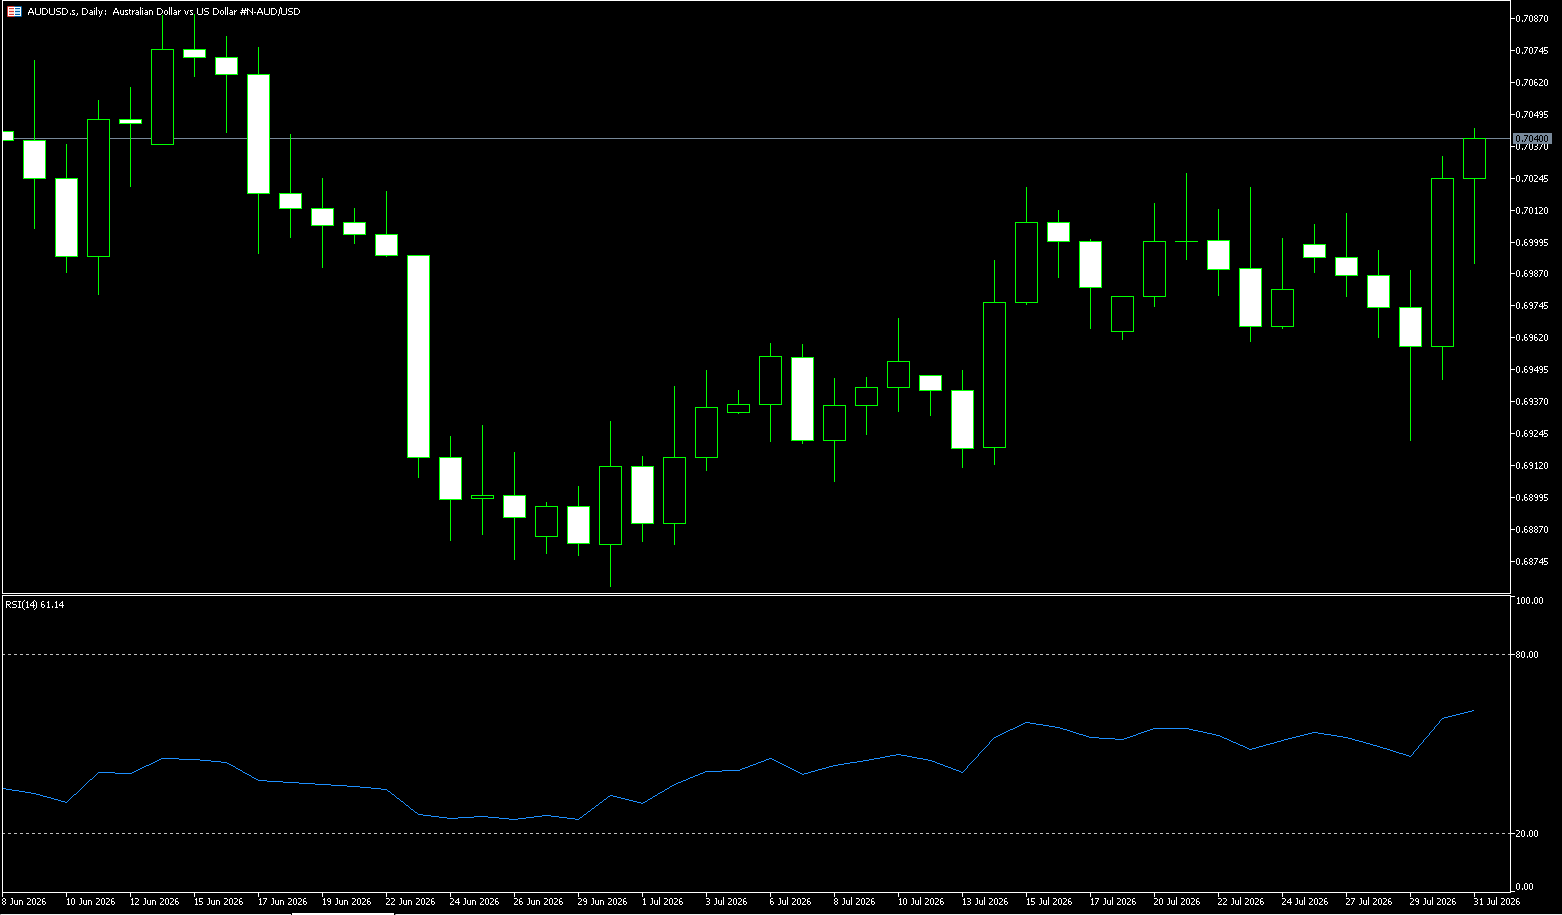
The Australian dollar weakened slightly in Asian trading on Thursday, retreating from its high since June 17th reached the previous day. The spot price is currently trading not far below 0.7040, but downside appears limited. Despite market optimism regarding a potential US-Iran deal and the reopening of the Strait of Hormuz, the US dollar gained some positive momentum and ended a two-day losing streak as short sellers awaited further developments related to the Middle East crisis. This, in turn, was seen as a key factor putting some pressure on the AUD/USD pair. However, a meaningful decline seems unlikely ahead of Chinese trade balance data and Friday's key US non-farm payroll report. Furthermore, the announcement by Iran and Oman of establishing a shipping corridor in the Strait of Hormuz boosted hopes for improved energy supplies in the Middle East. The partial reopening of the key waterway put pressure on the dollar as falling oil prices eased inflationary pressures and reduced market expectations for more aggressive rate hikes by the Federal Reserve.
From a technical perspective, spot prices struggled to continue the gains following the previous day's break above the 100-day simple moving average of 0.7052 and encountered resistance before the 50% Fibonacci retracement level of the May-June decline. However, the Moving Average Convergence Divergence (MACD) indicator remains mildly positive. Furthermore, the Relative Strength Index (RSI) near 58 indicates constructive momentum but has not yet entered overbought territory, suggesting that pullbacks may still attract buyers. However, traders may wait for follow-through buying above the immediate resistance levels of 0.7070 (50%) and the 16-day high of 0.7075 before positioning for further gains. Given the recent rebound from the crucial 200-day simple moving average, a break above this level would target the 61.8% level at 0.7120, followed by the 78.6% retracement level around 0.7191. On the downside, initial support lies at the psychological level of 0.7000, with further demand potentially seen at the 23.6% level at 0.6958 and near the 200-day simple moving average at 0.6920.
Consider going long on the Australian dollar at 0.7020 today, with a stop loss at 0.7010 and targets at 0.7070 and 0.7080.
GBP/USD
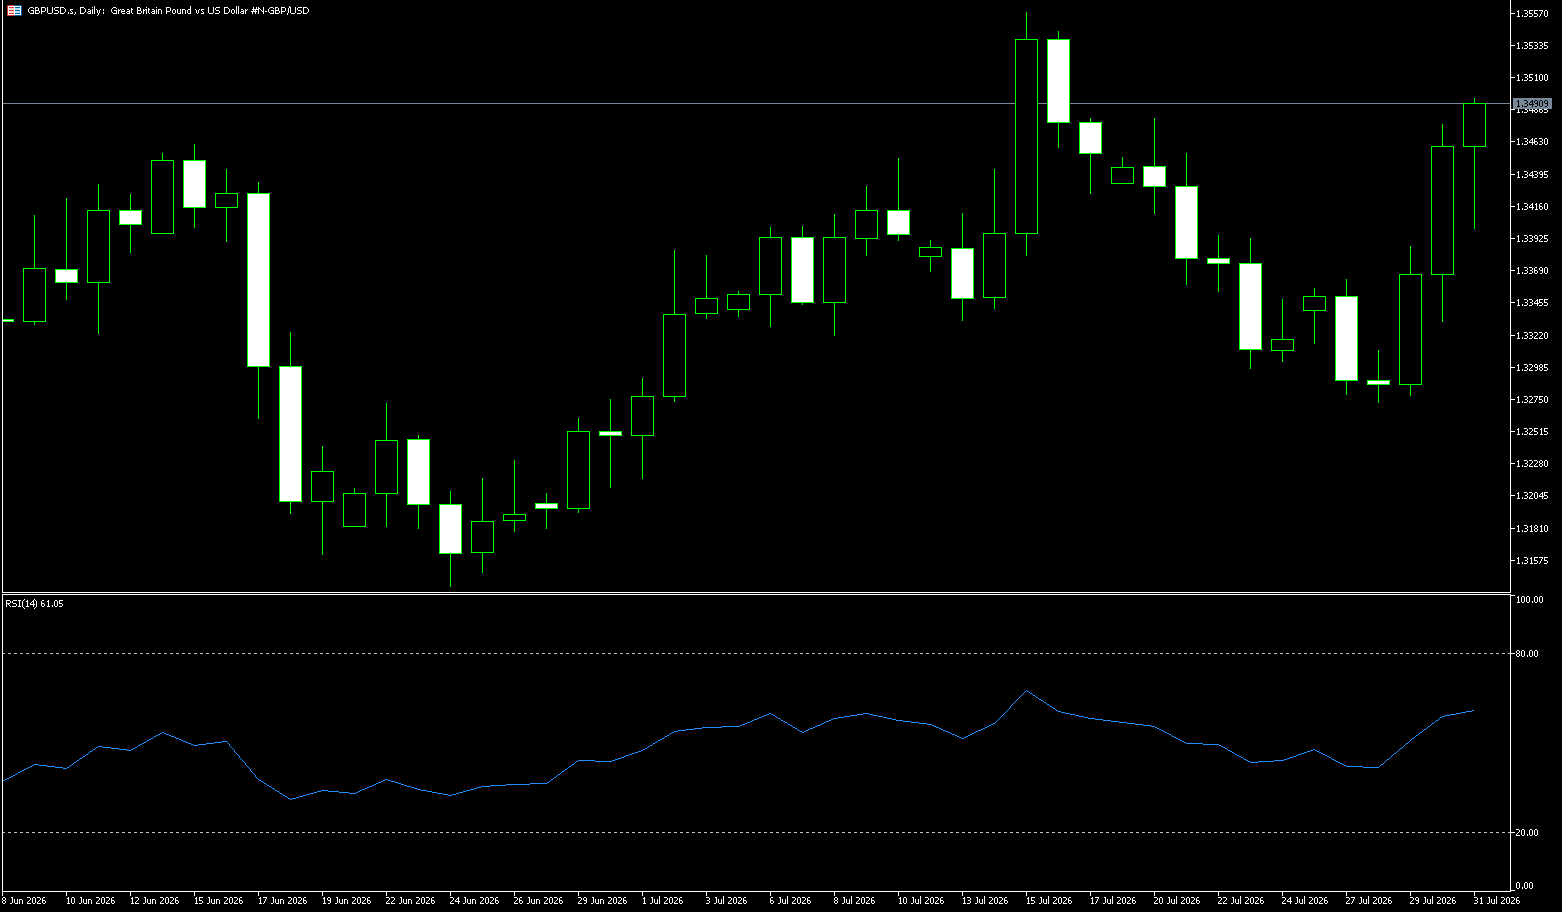
The GBP/USD pair fell back to around 1.3450 during Thursday's early European session. Conflicting statements from US and Iranian officials regarding a potential deal fueled market concerns, dragging the pound lower against the dollar. US President Trump said on Wednesday that he had very productive talks with Iran. Meanwhile, US Vice President JD Vance said negotiations with Iran would be "very messy" and time-consuming, adding that "the Iranians are extremely difficult to deal with" and that the "system is broken." On the other hand, weaker-than-expected US economic data may pressure the dollar and provide support for major currency pairs. ADP reported on Wednesday that US private sector employment increased by 44,000 in July, down from 98,000 in June. This figure was lower than the market expectation of 70,000. The US July jobs data will be in focus later on Friday. Any signs of weakness in the US labor market could prompt traders to postpone their bets on a Federal Reserve rate hike, putting downward pressure on the dollar.
On the daily chart, GBP/USD is holding above the 100-day simple moving average at 1,3404 and the Bollinger Band middle line at 1,3407, both of which reinforce the short-term bullish bias as prices continue to rise in the upper half of the recent range. The 14-day Relative Strength Index (RSI) is near 57, showing constructive momentum but not yet entering overbought territory, leaving room for further gains. However, the upside remains capped by the Bollinger Band middle line at 1,3543, and buyers at 1,3558 (the July 16 high) may face profit-taking and a potential pause in the rally. On the downside, immediate support lies at the confluence of the 100-day simple moving average at 1,3404 and the Bollinger Band middle line at 1,3407, forming a key support zone; a break below this support could lead to a deeper pullback to the 1,3379 (30-day moving average) support level.
Today, consider going long on GBP at 1.3443, with a stop-loss at 1.3430 and targets at 1.3490 and 1.3500.
USD/JPY
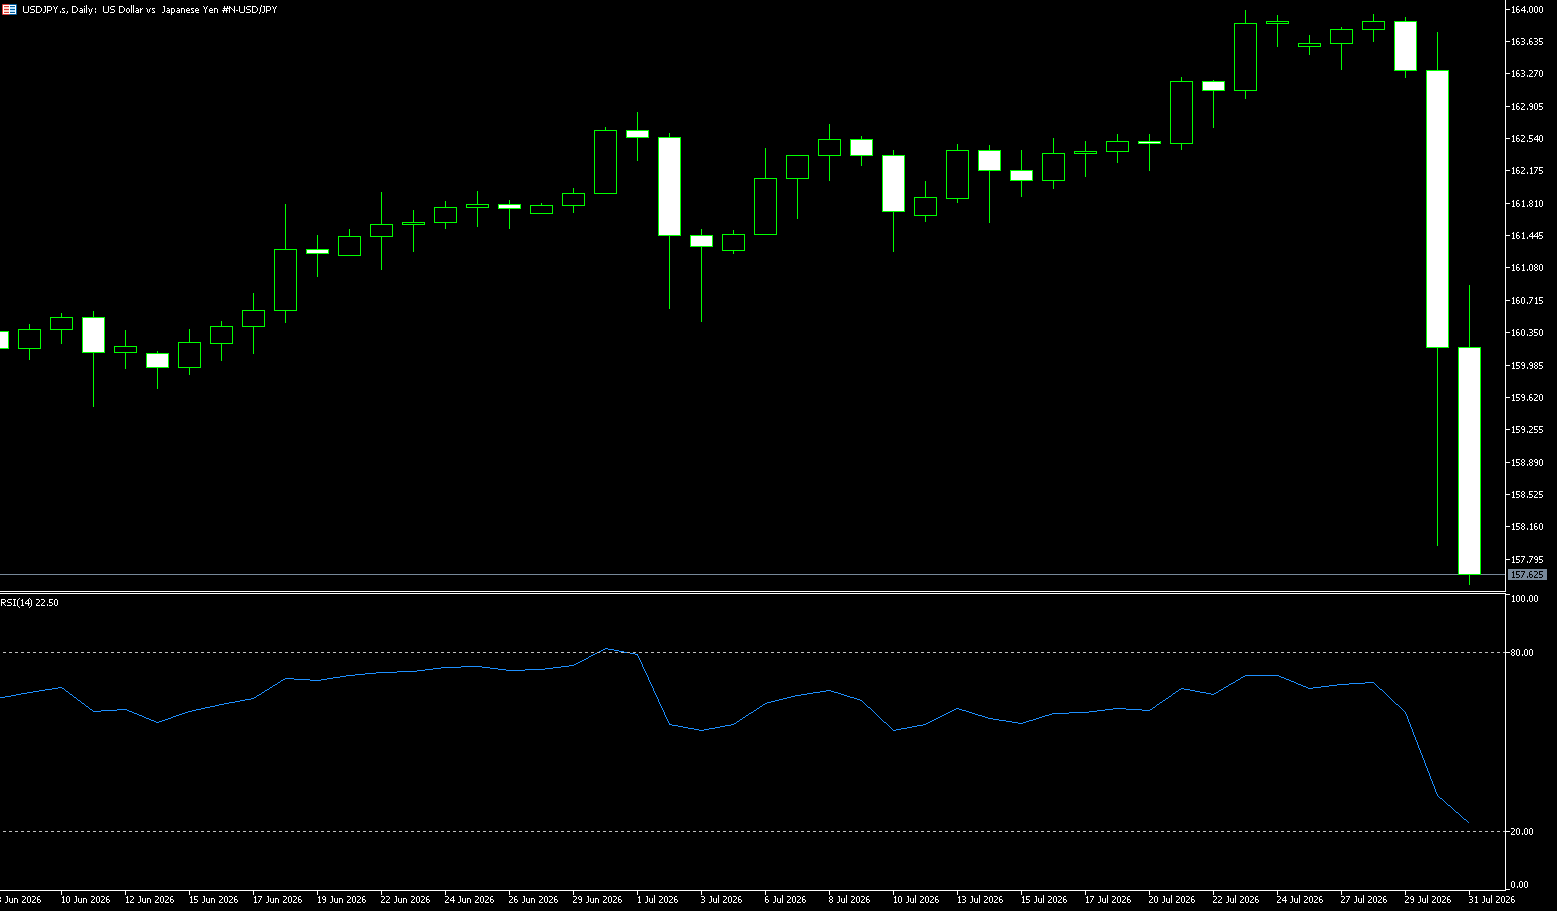
The USD/JPY pair rose slightly on Thursday, approaching 158.50, extending the yen's fourth consecutive day of weakness as it recovered some of the ground lost due to coordinated intervention by Japan and the US last week. Financial markets expect the yen to struggle to maintain its strength driven by the joint US-Japan intervention unless there are structural changes in the domestic economy that provide a boost. Yen positioning has stabilized, with the market viewing subsequent actions by the Bank of Japan as key to attracting renewed capital inflows; meanwhile, expectations for further US-Japan intervention are rising, as Japanese Finance Minister (FM) Satsuki Katayama confirmed earlier this week that Japan "will not hesitate to take further foreign exchange intervention with the US." Regarding the dollar, investors will focus on the US July non-farm payroll data to be released on Friday.
USD/JPY is trading around 158.50, maintaining a bearish tone in the short term as the spot price remains below the 20-day exponential moving average (EMA) at 161.41. The pair has retreated from recent highs, and the EMA above suggests that despite the latest attempt to rally, prices remain under pressure, indicating a market correction rather than a continuation of the uptrend. On the upside, initial resistance is at 160.00 (a psychological level), followed by the 20-day EMA at 161.41. This constitutes a major obstacle for bulls to reclaim in order to alleviate downward pressure. On the downside, key support for the pair is at 157.00 (a psychological level); a break below this level would see the next support at the two-month low of 155.23.
Today, consider shorting the US dollar at 158.70, with a stop-loss at 158.90 and targets at 157.80 and 157.60.
EUR/USD
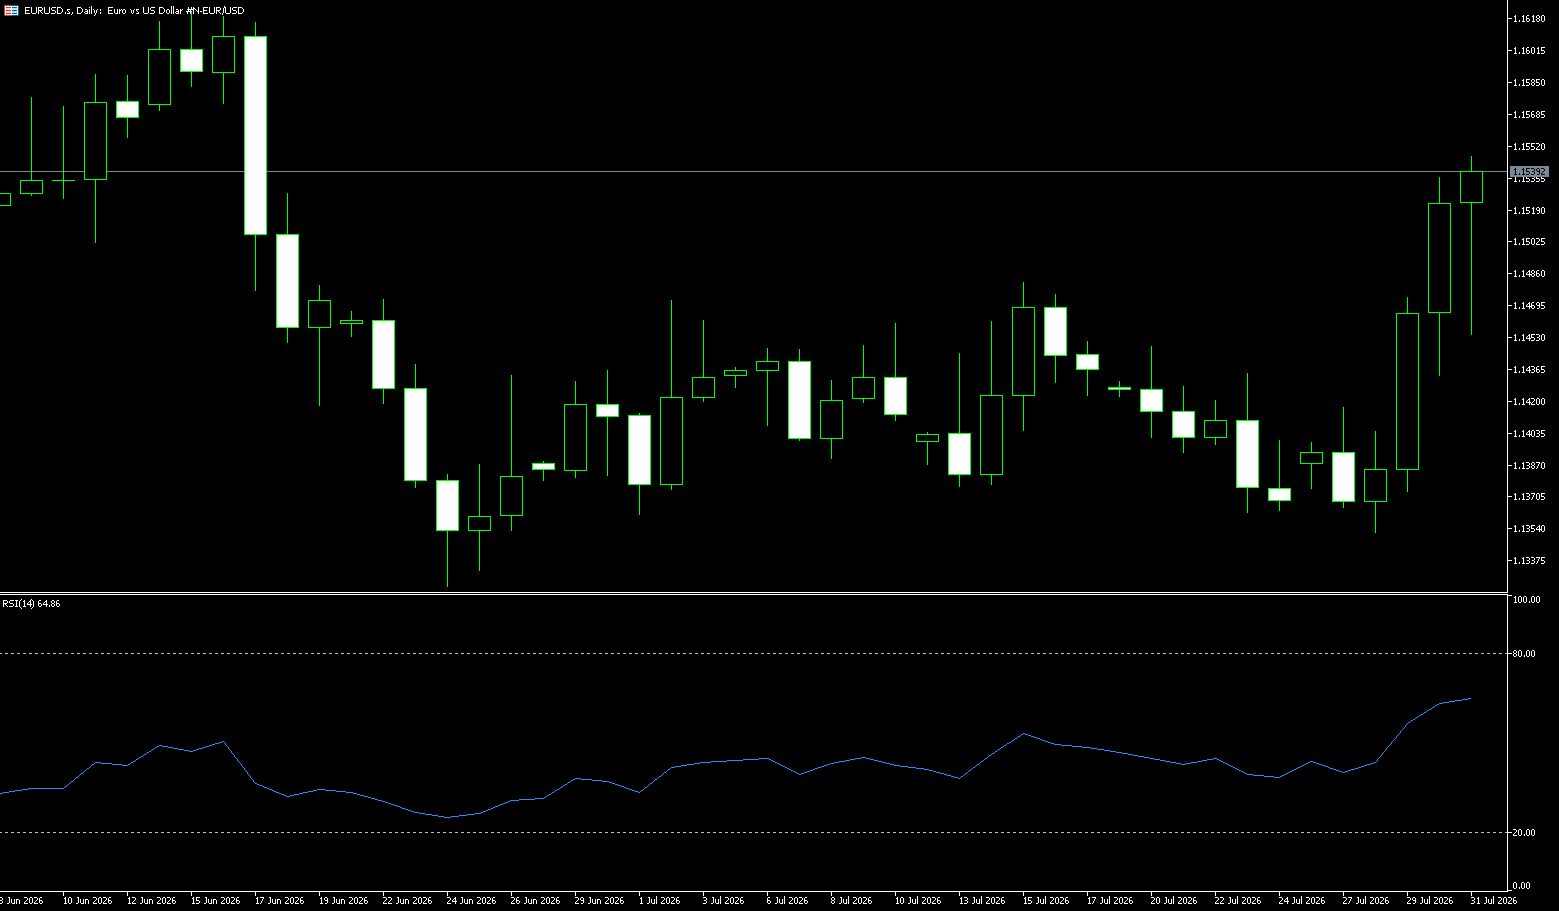
At the opening of the European session on Thursday, the euro was largely unchanged against the dollar. After rebounding approximately 1.6% from last week's lows, the euro/dollar pair held onto gains in the 1.1530-1.1540 range. The euro continued to receive support due to lower oil prices and positive Eurozone data, while investor caution ahead of the US non-farm payroll data put pressure on the dollar. In the US, Wednesday's ADP employment data was disappointing, showing an increase of 44,000 jobs, less than half of the 98,000 increase in June and far below the market consensus of 70,000. Geopolitically, Reuters reported that Iran and Oman proposed an agreement to reopen the Strait of Hormuz, which would give Tehran control over maritime traffic. The US government has not responded to the plan, but US President Donald Trump has strongly opposed the possibility of Iran controlling the strait.
From a technical perspective, the short-term price action of EUR/USD shows additional near-term resistance around 1.1560 (this week's high), but no significant resistance is seen before the 200-day simple moving average at 1.1630. Against this backdrop, it is expected to trade within a range between 1.1500 and 1.1600 in the near term, as the euro consolidates its recent gains. The daily MACD remains positive, with the DIFF above the zero line, indicating some bullish momentum, but the red bars are contracting, suggesting a weakening of upward momentum. The nearest support level is 1.1447 (the 20-day simple moving average), a key level to determine whether this rebound will continue. As long as the daily close holds above the 20-day simple moving average, the medium-term rebound structure will remain intact; a drop below this level to the 1.1400 level would signal a weakening of the rebound.
Today, consider going long on the Euro at 1.1510, with a stop-loss at 1.1500 and targets at 1.1560 and 1.1570.
Stock Analysis:
Australian ASX 200 Stock Index
Basic Market Overview:
The Australian Securities Exchange (ASX) 200 index rose 44 points, or 0.5%, to a new high of 9,272 on Thursday, extending its four-day winning streak. Momentum was supported by Australia's unexpected trade surplus in June, a rebound in exports, coupled with new capital inflows at the start of the fiscal year and a surge in confirmed building permits. US stock index futures also strengthened on optimism that a US-Iran peace agreement could end the five-month conflict and reopen the Strait of Hormuz. Glencore was in the spotlight for corporate news, announcing plans for a secondary listing in Australia in October. However, traders remained cautious about July trade data from China, a major trading partner, due on Friday.
Sectors performed strongly, with non-energy mining, consumer services, and consumer goods companies leading the gains. Evolution Mining rose 3.8%, Northern Star Resources rose 3.3%, and ASX 200 rose 2.1%, while three of the Big Four banks rose between 0.3% and 0.9%. Stocks that declined relatively included Woods Energy (-0.2%) and Wisetech Global (-1.5%).
Sector Performance:
Leading Sectors:
1. Non-Energy Mining (Materials): Gold mining companies were boosted by stronger gold prices, with Evolution Mining up 3.8% and Northern Star Resources up 3.3%; Fortescue up 1.43%.
2. Consumer Services & Consumer Discretionary: Domestic consumption remained resilient, leading to widespread gains in the consumer sector.
3. Financials & Banks: Three of the four major banks rose, with gains ranging from 0.3% to 0.9%, as expectations of peak interest rates benefited bank valuations.
Leading Sectors:
1. Energy Sector: Falling oil prices weighed on the sector, with Woodside Energy down 0.2%.
2. Information Technology: Wisetech Global down 1.5%, with growth stocks relatively weak.
Technical Analysis:
The Australian ASX 200 stock index closed at 92,71.60 points on Thursday, +43.8 points {+0.47%}, marking its fourth consecutive day of gains and setting a new record closing high. Intraday movement: The index rose in the morning, briefly retreated in the afternoon, and then saw a buying rebound towards the close, finishing near the day's high. Key drivers: Australia's June trade surplus exceeded expectations, new fiscal year capital inflows, and positive building permit data; improved expectations of US-Iran peace talks boosted global risk appetite; however, market attention was focused on Friday's Chinese July trade data, limiting further gains. Daily trend: Medium-term bullish, short-term overbought, RSI rising and approaching overbought territory, the index has stabilized above all major moving averages, but profit-taking pressure exists after four consecutive days of gains.
Friday's Market Outlook: 1) Optimistic Scenario: Positive Chinese trade data, continued overnight positive sentiment in overseas markets, pushing the price towards the 9300 resistance level; 2) Neutral Scenario: Profit-taking after new highs, consolidating within the 9200-9280 range; 3) Pessimistic Scenario: Weaker-than-expected Chinese trade data, coupled with overbought conditions, leading to a pullback towards the 9150 support level. Key Events on Friday: China's July trade import and export data. As Australia's largest trading partner, this data will directly impact the materials and mining sectors, thereby influencing the ASX200 index.
Trading Strategy:
Trading Strategy (Short-Term Trading Perspective)
1. Bullish Strategy
• Consider a small long position if the price retraces to the 9200-9210 range and stabilizes; set a stop-loss below 9140; first target 9280, second target 9300.
• Avoid chasing highs: The index has risen for four consecutive days. Avoid chasing the price directly above 9270, as the risk-reward ratio is very poor.
2. Short-selling strategy
• If the price rises to 9290-9300 and encounters resistance, showing a clear pullback candlestick pattern, a short-term pullback can be considered; place the stop-loss above 9330; target 9220-9200, with a further target of 9150 if it breaks through.
3. Wait-and-see strategy
• Volatility is amplified before and after data releases. Risk-averse investors should wait for the release of Chinese trade data and for the index to move out of the 9200-9300 range before choosing a direction.
Key risk warning:
Data risk: Friday's Chinese July trade data. If exports are significantly lower than expected, the mining and materials sectors will be under pressure, directly dragging down the ASX200.
Overbought/Pullback Risk: Four consecutive days of gains have pushed the RSI into overbought territory, potentially triggering profit-taking. Volatility will be significantly amplified at this historical high.
External Risks: Recurring tensions between the US and Iran, significant fluctuations in international oil prices, and the overnight reversal in US stocks will directly impact the opening of the Australian stock market.
Sector Divergence Risk: The market is highly dependent on gold and resource stocks. If commodities weaken, the upward momentum of the index will quickly diminish.
New Zealand 50 Index (NZX50)
Basic Market Overview:
The New Zealand stock market fell 39 points, or 0.3%, to close at 13,958 on Thursday, ending a three-day winning streak as traders took profits after the index hit a record high. Investors continued to assess New Zealand's second-quarter unemployment data, which showed the unemployment rate rising to 5.6%, the highest level since the third quarter of 2015, accompanied by surging inflation. This raised questions about the Reserve Bank of New Zealand's monetary policy decisions at its upcoming meeting. Traders remained cautious as they awaited Friday's Chinese trade data and US employment data. However, optimism surrounding US-Iran peace talks pushed oil prices further down, mitigating the stock market decline, as easing inflation concerns reduced expectations of interest rate hikes.
The healthcare, energy, consumer goods, and financial sectors were the main drags on the index, with the worst performers including Fisher & Parker (-1.6%), Australian Infrastructure Investments (-1.5%), Freight Group (-1.3%), Abbots Group (-1.1%), and Imfretir (-0.9%).
Sector Performance:
Leading Sectors
1. Healthcare & Retirement (Retirement Communities): Retirement operators performed strongest, benefiting from cooling employment data and rising expectations of interest rate cuts.
◦ Representative Stocks: Summerset Group +4.5%, Oceania Healthcare +3.2%
2. Industrial Materials/Infrastructure: Building materials and logistics sectors strengthened.
◦ Representative Stocks: Fletcher Building +2.7%, Freightways +2.4%
Leading Sectors
1. Commercial Real Estate: Commercial property sector saw a significant pullback.
◦ Representative Stocks: Goodman NZ -4.3%, Precinct Properties -1.9%
2. Telecommunications: Suppressed by Starlink competition expectations.
◦ Representative Stocks: NZX (Exchange) -1.3%, Spark NZ under pressure.
3. Divergence among some healthcare blue chips: Ryman Healthcare -2.4%, significant divergence within the same sector.
Technical Analysis:
NZX50 New Zealand 50 Index closed at 13958 on Thursday. The index fell 0.3% (-39 points), ending a three-day winning streak. Having just reached a record high of 13997 points on Wednesday, this move likely reflects profit-taking at higher levels. The driving logic was that New Zealand's Q2 unemployment rate rose to 5.6% (the highest since Q3 2015), but inflation also increased, leading to greater market divergence regarding the Reserve Bank of New Zealand's future interest rate decisions. Capital was taking profits at higher levels. The market anticipated US employment and Chinese trade data on Friday, as these external factors directly impacted risk appetite in the Asia-Pacific region. Falling oil prices limited the index's decline, easing concerns about inflation and interest rate hikes, preventing further significant drops.
Friday's technical pattern: After a surge, the index retreated slightly, closing with a small bearish candlestick. The RSI slightly retreated from overbought territory. While the overall upward trend remains intact, the market has entered a consolidation phase in the short term. Friday's trading is highly likely to be influenced by external data, leading to increased volatility. A range-bound trading pattern is expected, with a low probability of a sharp, one-sided rise or fall. Friday's Market Outlook: Strong Scenario: Holds above 13920, maintaining high-level consolidation, awaiting a move to a new historical high. Weak Scenario: A decisive break below 13920, further testing the 13860-13880 support level.
Trading Strategy:
Friday's Trading Strategy (Short-term trading reference only, not investment advice):
1. Bullish Strategy
• If the price retraces to the 13920-13930 support zone and stabilizes, a small long position can be attempted; stop-loss below 13870; first target is the 13980-13997 historical high, a break above which could lead to further gains.
2. Bearish Strategy
• If the price opens with immediate downward pressure and decisively breaks below 13920, a small short position can be attempted; stop-loss above 13970; target is the 13880-13860 support zone.
3. Conservative Approach: Friday features two major data releases: US employment and Chinese trade. With high uncertainty, it's advisable to wait and see, allowing the data to be released before making a directional decision, thus avoiding disorderly fluctuations due to news.
Key Risk Warnings:
Macroeconomic Data Risk: Friday's US non-farm payrolls and Chinese trade data, if significantly exceeding expectations, could directly disrupt global risk appetite, causing the NZX50 to gap down and potentially breaching pre-set stop-loss levels.
New Zealand Domestic Policy Risk: Rising unemployment coupled with persistent inflation, and the Reserve Bank of New Zealand's wavering stance, could change market expectations for interest rate cuts/hikes at any time, disrupting the index.
Market Structure Risk: The NZX50 index is highly concentrated in a few large-cap stocks. Movements in these large-cap stocks can cause significant index volatility. Small-cap stocks have low trading volume, and liquidity risk cannot be ignored.
Disclaimer: The information contained herein (1) is proprietary to BCR and/or its content providers; (2) may not be copied or distributed; (3) is not warranted to be accurate, complete or timely; and, (4) does not constitute advice or a recommendation by BCR or its content providers in respect of the investment in financial instruments. Neither BCR or its content providers are responsible for any damages or losses arising from any use of this information. Past performance is no guarantee of future results.
More Coverage





Risk Disclosure:Derivatives are traded over-the-counter on margin, which means they carry a high level of risk and there is a possibility you could lose all of your investment. These products are not suitable for all investors. Please ensure you fully understand the risks and carefully consider your financial situation and trading experience before trading. Seek independent financial advice if necessary before opening an account with BCR.
BCR Co Pty Ltd (Company No. 1975046) is a company incorporated under the laws of the British Virgin Islands, with its registered office at Trident Chambers, Wickham’s Cay 1, Road Town, Tortola, British Virgin Islands, and is licensed and regulated by the British Virgin Islands Financial Services Commission under License No. SIBA/L/19/1122.
Open Bridge Limited (Company No. 16701394) is a company incorporated under the Companies Act 2006 and registered in England and Wales, with its registered address at Kemp House, 160 City Road, London, England, EC1V 2NX. Open Bridge Limited acts solely as a payment processor for BCR Co Pty Ltd and does not provide any financial, trading, or investment services on its behalf. Open Bridge Limited's role is limited to payment processing.


 English
 简体中文
简体中文
 繁體中文
繁體中文
 Bahasa
Melayu
Bahasa
Melayu
 Tiếng
Việt
Tiếng
Việt
 ไทย
ไทย
 日本語
日本語
 한국어
한국어
 ភាសាខ្មែរ
 español