

0
US Dollar Index
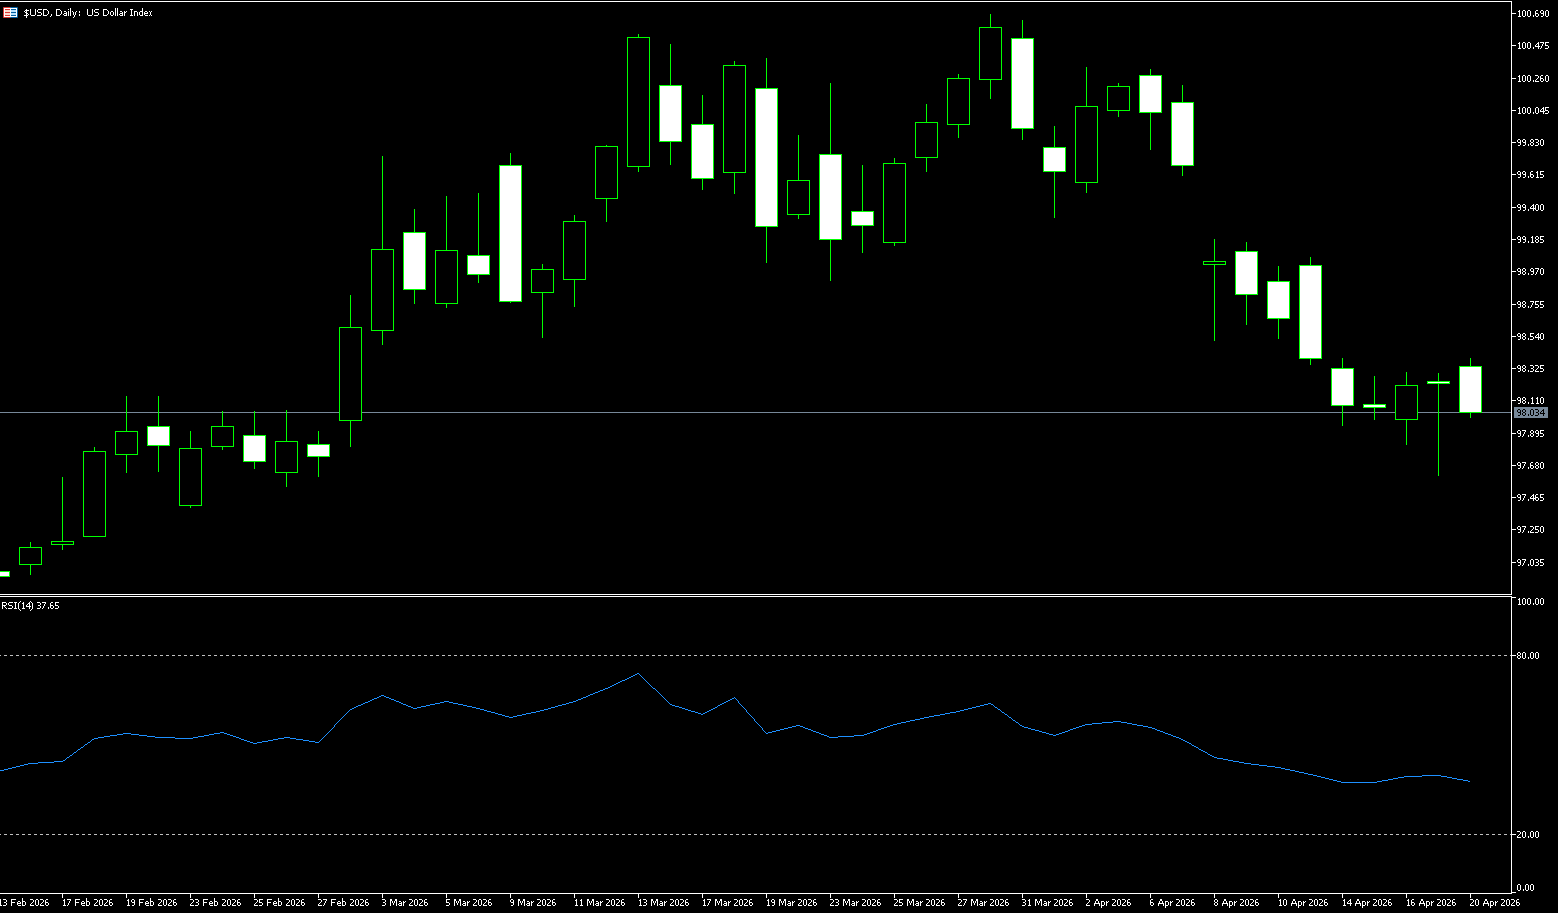
The US dollar index climbed to around 98.00 on Monday, recovering some of last week's losses, as renewed tensions between the US and Iran boosted demand for safe-haven currencies. President Donald Trump stated that the US Navy fired on and seized an Iranian-flagged cargo ship as it departed the Strait of Hormuz after ignoring warnings to stop. Tehran also withdrew its plans to reopen the Strait of Hormuz after Washington refused to lift its blockade of Iranian ports and indicated it would not participate in a second round of negotiations. The ongoing conflict has triggered a significant energy supply shock, exacerbating inflation risks and increasing the likelihood of further interest rate hikes, while dampening market expectations for a Federal Reserve rate cut this year. The market widely expects the Fed to keep its policy rate unchanged this month and for the remainder of 2026.
The daily chart shows that the US dollar index has decisively broken below its upward trajectory since March, hitting a seven-week low of 97.63 on Friday. Although the exchange rate rebounded above the 98 level after the market closed, it is currently under pressure from the 50-day simple moving average (98.75), and the bearish momentum continues to be released; the current decline in the US dollar is more of a "concentrated liquidation of safe-haven positions". The RSI technical indicator has rebounded from oversold territory to around 41, indicating weakening short-term downward momentum and a need for correction. The MACD histogram shows a significant decrease in green bars, and the fast line shows signs of turning upwards, suggesting weakening bearish pressure. Tuesday's retail sales data (commonly known as "the terror data") is crucial. If the data reflects stronger-than-expected domestic demand, the US dollar may find technical support and rebound around the 97.82 (last week's low) and 98.00 (psychological level). A break above these levels would target the 97.50 level. On the upside, consider the 50-day simple moving average at 98.75, followed by the 99.00 (psychological level) and the 99.06 (last week's high) area.
Today, consider shorting the US dollar index at 98.15, with a stop-loss at 98.25 and targets at 97.70 and 97.80.
WTI Crude Oil
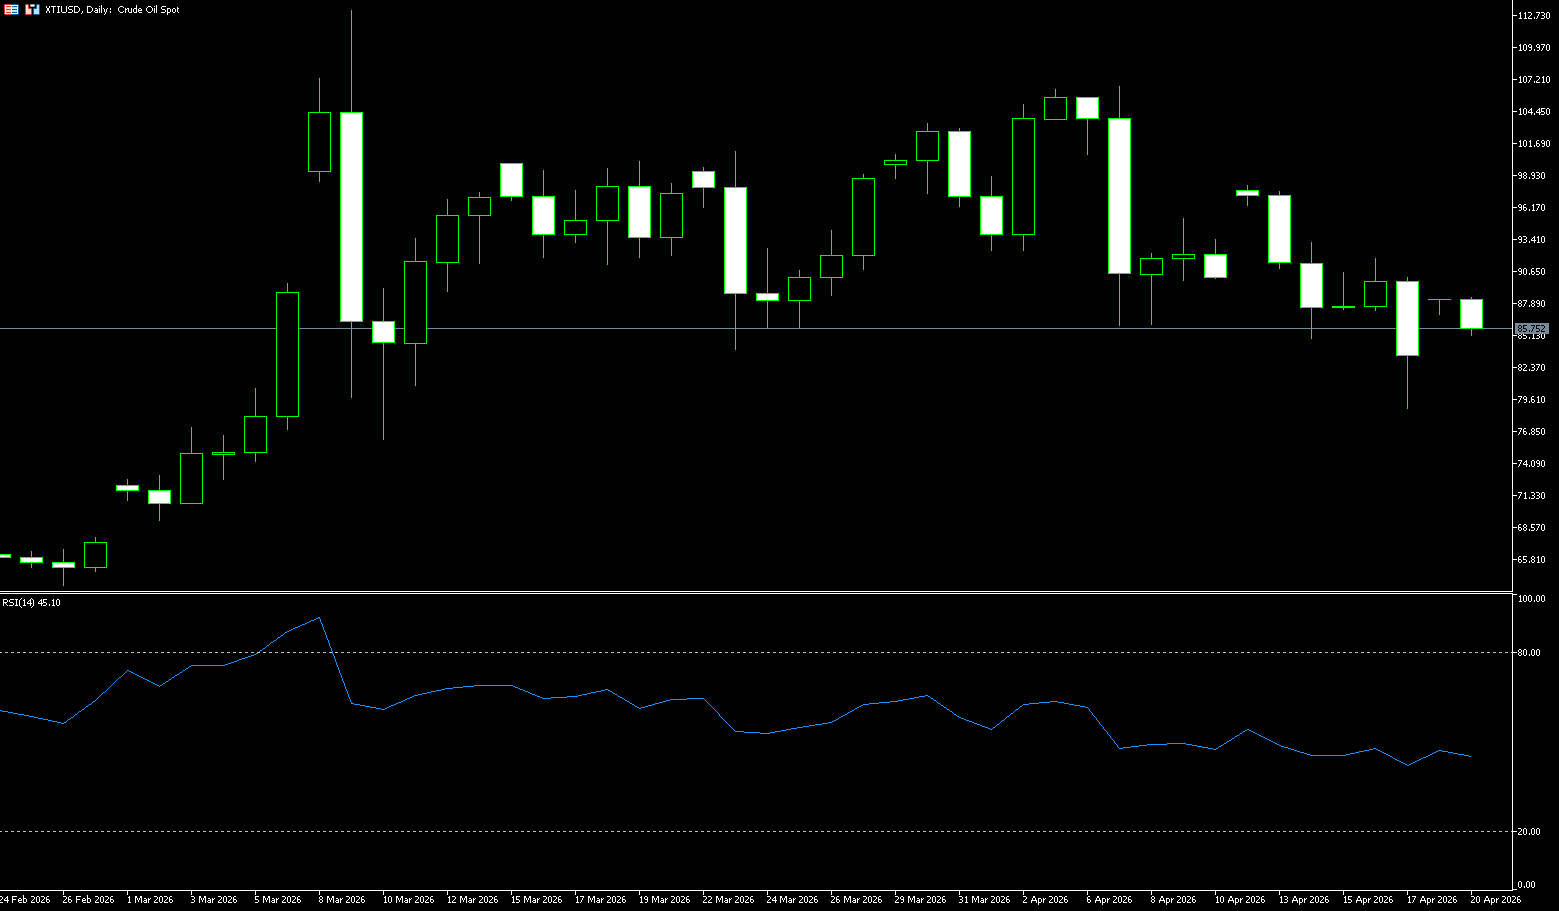
Iran warned that war could resume at any time, and its armed forces are on full alert. Oil prices rebounded by more than 7% on Monday, with US crude trading around $88.20 per barrel. The Iranian parliament speaker warned that trading oil based on sentiment is no different from hedging US Treasury risks—both are "castles in the air." Iran suddenly announced the reclosure of the Strait of Hormuz on Saturday, less than a day after its brief reopening, immediately drawing international attention. This strategic waterway, a core channel for global oil transportation, is repeatedly closed and reopened, directly testing the fragility of US-Iran negotiations and casting a shadow over the Middle East peace process. Following the incident, US President Trump clearly stated that Iran cannot use this to blackmail the US, and multiple ships attempting to pass through were met with gunfire, further escalating regional tensions. Geopolitical uncertainty remains high. If a final US-Iran agreement cannot be reached, or if the 10-day ceasefire in Lebanon fails to hold, traffic in the strait could be disrupted again. The future trend of global oil prices will depend closely on the latest developments in US-Iran negotiations, the actual implementation of the regional ceasefire agreement, and the degree of compromise among the parties on the nuclear issue.
Overall, this week marked a turning point for global commodity market pricing power, shifting from "war expectations" back to a "peace premium." The sharp correction in the crude oil market signaled the end of the short-term extreme geopolitical premium, with prices falling back to near fundamental anchors. However, fundamental recovery will not happen overnight, and subsequent attention should be paid to the progress of the US in reclaiming specific materials and the implementation of the unfreezing of Iranian funds. On the daily chart, after a one-sided decline, the market is consolidating at low levels, indicating a continuation/weak recovery pattern, without a clear reversal signal. Therefore, this week, the market must firmly establish itself above $85.21 (the 45-day moving average) and $85.00 (a psychological level), and break through $88.50 (the beginning of the week's high) and $90.12 (last week's high) to have any hope of reversing the weakness and reaching $98.15 (last week's high), or even the psychological level of $100. Conversely, if oil prices fall below $85.00-$85.21, the next target is $78.88 (last week's low).
Today, consider going long on crude oil at $85.40, with a stop loss at $85.25 and a target of $87.00. 88.00
Spot Gold
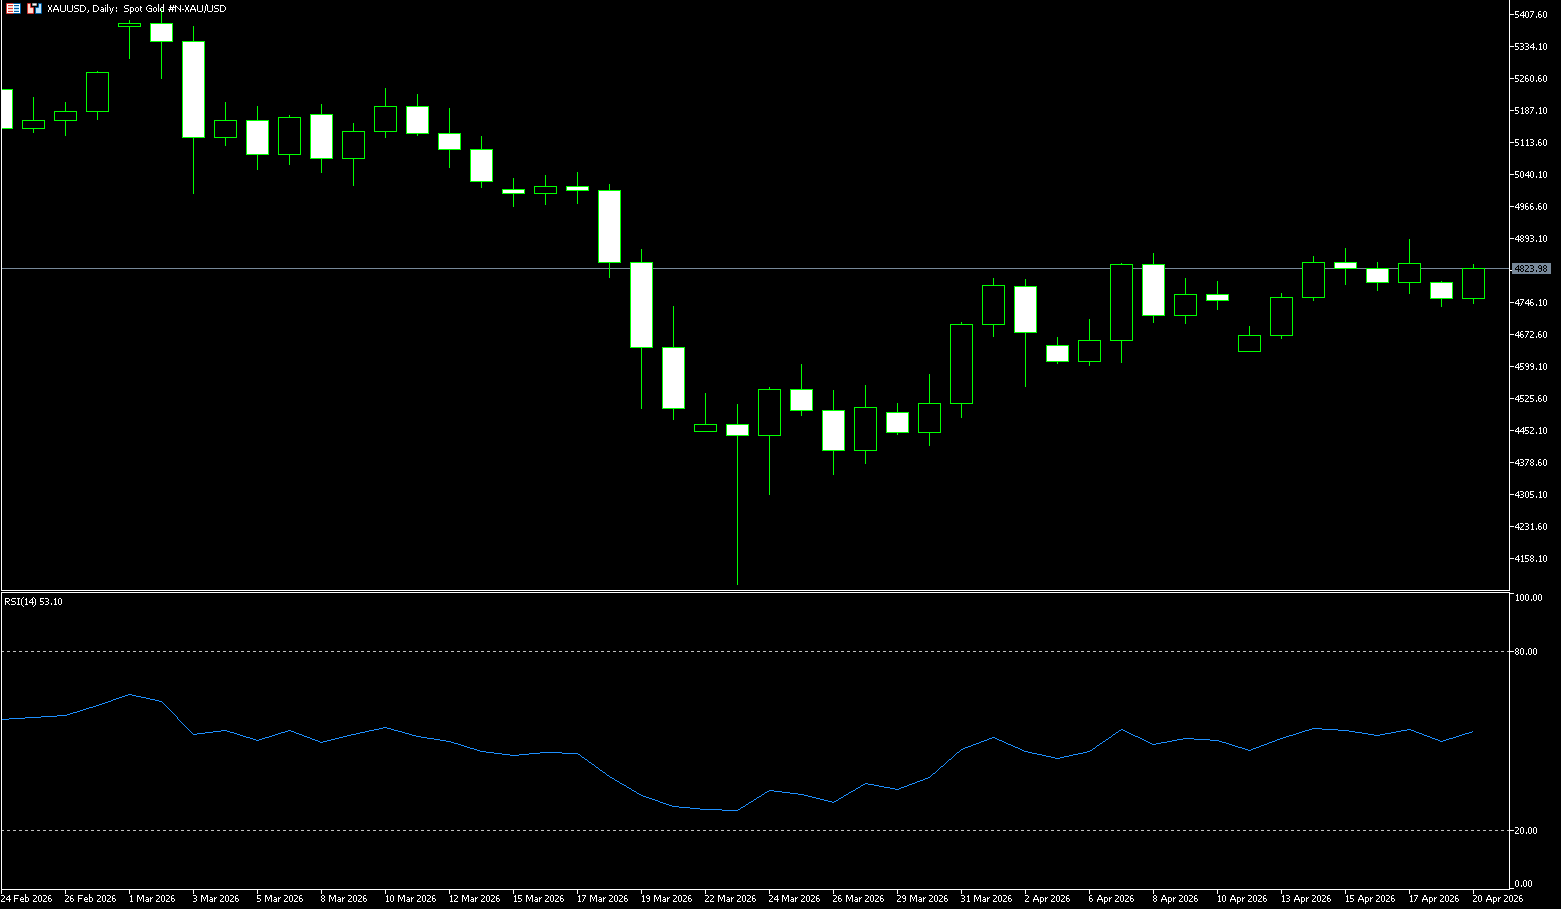
(April 20, Beijing Time) In early European trading, spot gold opened lower, trading near $4,820 per ounce, and may test the $4,900 per ounce level during the day. Tensions between the US and Iran escalated again over the weekend, with both countries accusing each other of attacking ships in violation of the ceasefire agreement, and the Strait of Hormuz closing again. In the current highly sensitive global energy supply chain, the situation in the Middle East has once again become the focus of international attention. Last weekend, both US President Donald Trump and Iran signaled some progress in negotiations; however, the situation in the Strait of Hormuz remains unpredictable, with the game of blockade and counter-blockade casting uncertainty on the future of this vital oil transport route. This crucial waterway once carried about one-fifth of the world's oil shipments, and any disturbance there could directly push up international oil prices and have a ripple effect on the global economy. This event once again reminds investors of the close yet fragile link between geopolitical tensions and global energy security. Developments in the coming days will directly determine whether stable navigation can be restored in the Strait of Hormuz and whether the US-Iran negotiations can achieve a substantial breakthrough.
Since its sharp correction at the end of January, spot gold has moved in a significantly different direction, entering a typical range-bound consolidation phase. Currently, the price is fluctuating between $4,700 and $4,850 per ounce, indicating a short-term balance between bullish and bearish forces. On the daily chart, spot gold is steadily trading above the Bollinger Band midline of $4,662 and has also risen above the 100-day moving average, suggesting a short-term bullish trend. The narrowing Bollinger Bands indicate decreasing volatility, foreshadowing a new round of price movement. The 14-day Relative Strength Index (RSI) is hovering around 50.40, above the neutral level of 50, reflecting a recovery in bullish momentum and no overbought condition. The rebound from the previous oversold zone suggests easing downward pressure, and the MACD indicator shows that bearish momentum is weakening while bullish forces are strengthening. Resistance levels: The first resistance is at the $4,850 level. If the bulls regain momentum, the 50-day moving average, around $4,894, may present new selling pressure. Support levels below: The first support is at $4,700 (a psychological level); meanwhile, the 20-day moving average at around $4,662 has become a key defensive level for any pullback.
Consider going long on spot gold today at $4,826, with a stop loss at $4,820 and targets at $4,895 and $4,910.
AUD/USD
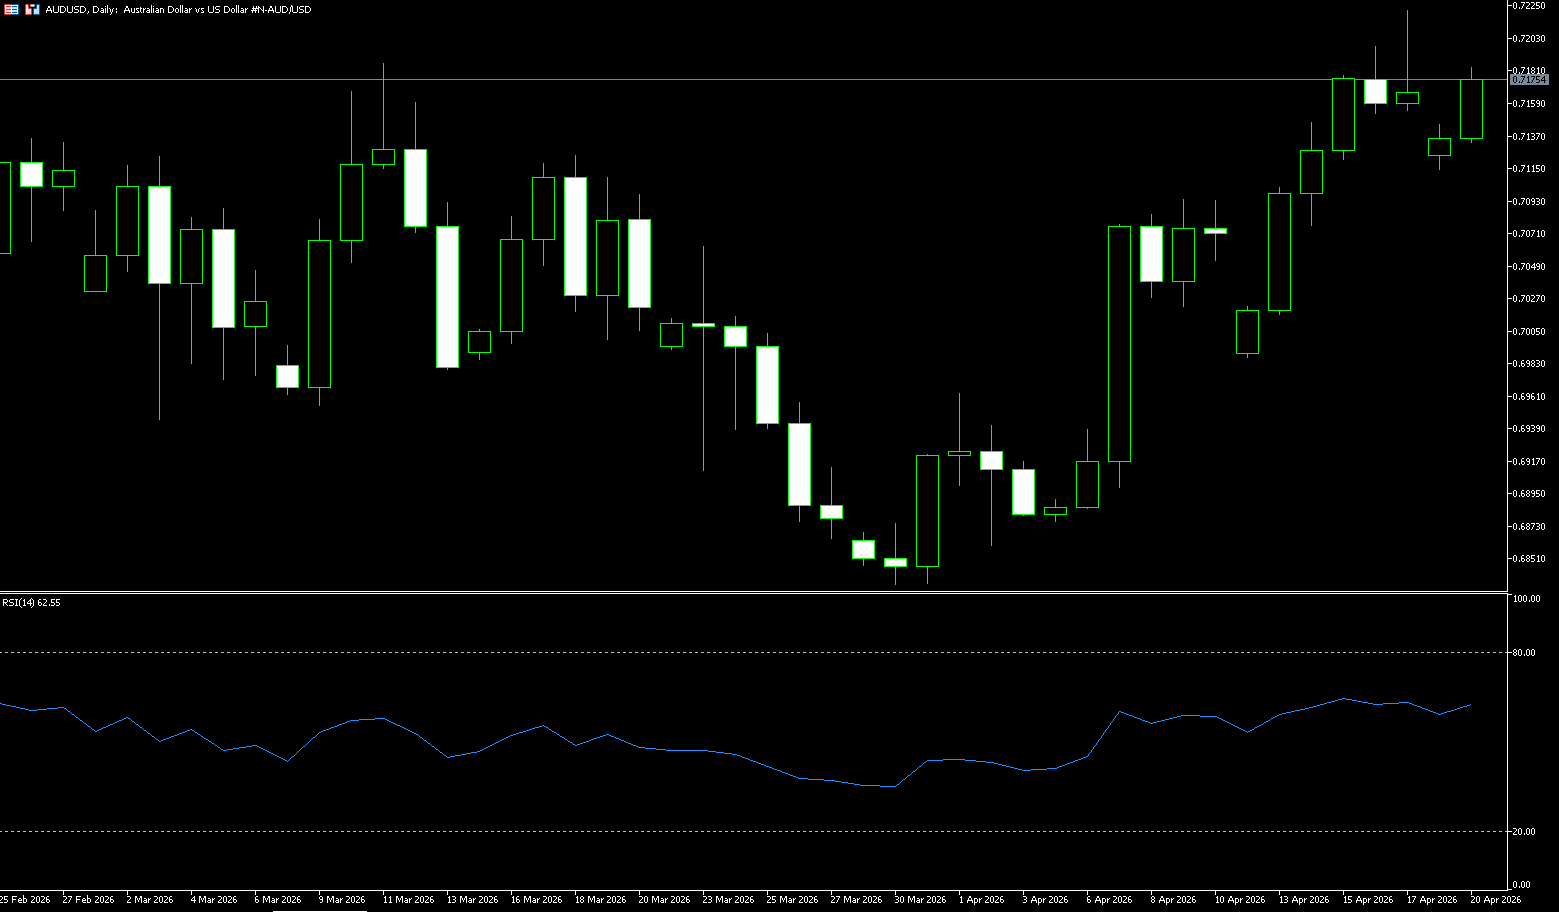
The Australian dollar retreated to around $0.7170, but remains near its highest level since May 2022, as renewed hostilities in the Strait of Hormuz pushed oil prices higher, although traders still hope for a solution. The ceasefire agreement in the Iran war is under renewed pressure after the US seized an Iranian cargo ship in the Gulf of Oman, prompting Tehran's top military command to vow retaliation and reaffirm control of the strait. Despite this, Trump indicated there is still a chance of a deal ahead of another round of talks in Pakistan, although Iran has little expectation of a resolution. The protracted conflict has triggered a historic energy supply shock, fueling inflation risks and expectations of further central bank rate hikes. In Australia, a strong labor market has reinforced expectations of tightening, with the market pricing in a 75% probability of a rate hike by the Reserve Bank of Australia next month. Investors are now awaiting the upcoming PMI report this week for further clues about the health of the economy.
On the daily chart, the Australian dollar is trading at 0.7170 against the US dollar, maintaining a short-term bullish bias as the spot price holds steady above the 55-day, 100-day, and 200-day simple moving averages between approximately 0.70 and 0.67. The pair is approaching a key upper resistance level at the Fibonacci swing high and around 0.7188, while the Relative Strength Index (RSI) (14) is at 62, indicating solid positive momentum approaching overbought territory, even though the Average Directional Index (14) is near 20, suggesting the overall trend strength remains moderate. On the upside, near-term resistance is at 0.7188; a daily close above this level would open the way to the psychological level of 0.7200; a daily close above this level would target the resistance level of 0.7283 (the May 2022 high). On the downside, initial support is seen near the psychological level of 0.7100 and the 23.6% Fibonacci retracement level around 0.7007.
Consider going long on the Australian dollar today at 0.7167, with a stop-loss at 0.7155 and targets at 0.7220 and 0.7230.
GBP/USD
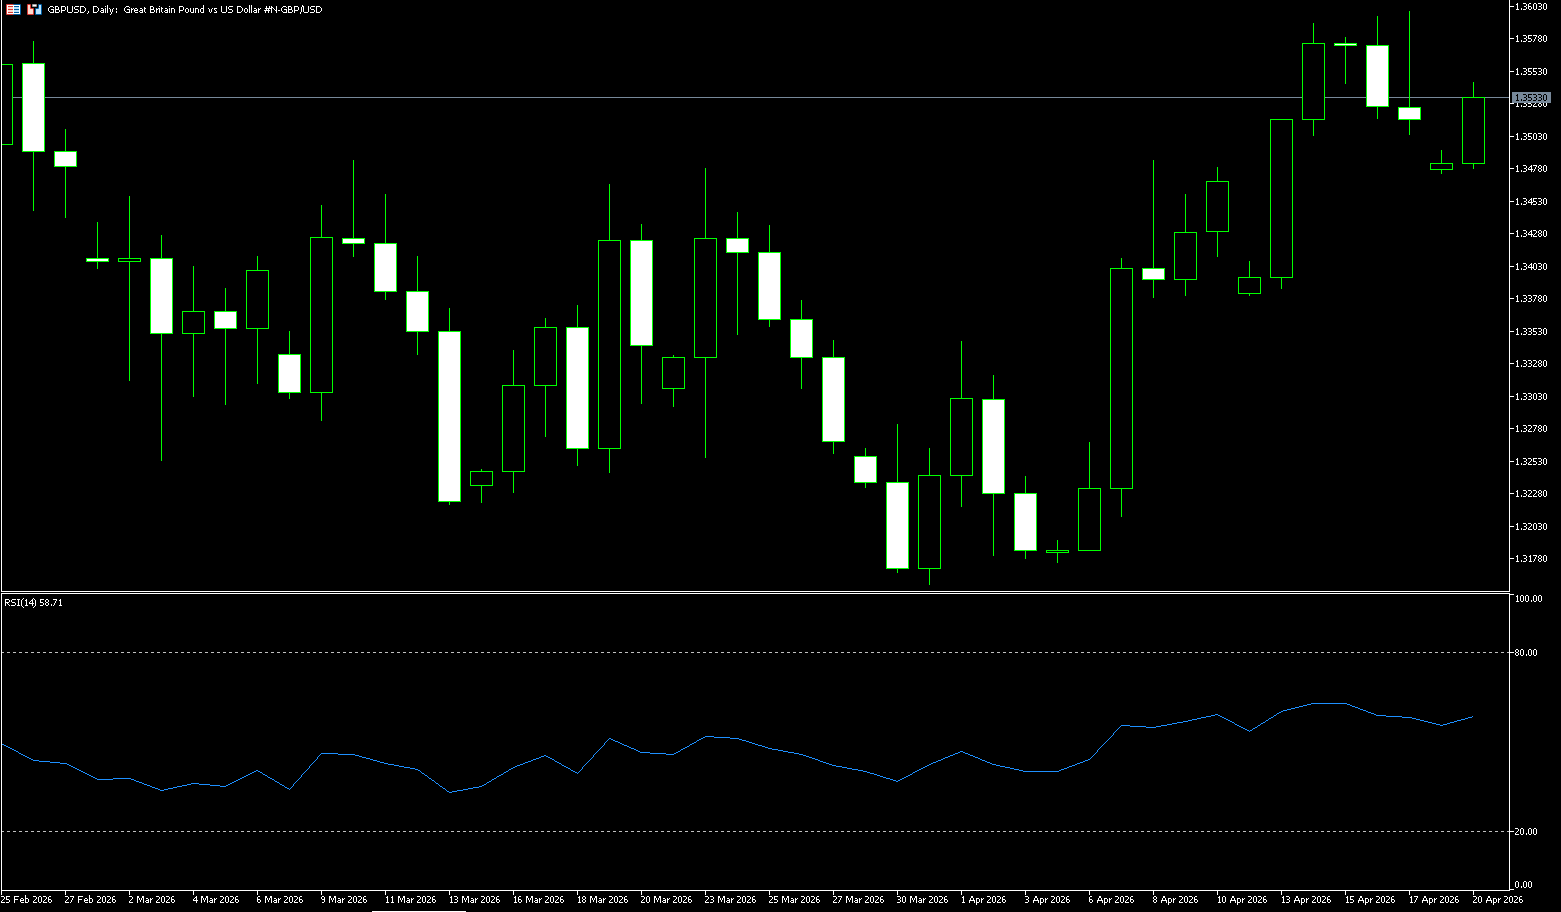
Despite tensions in the Middle East and the Fed's repricing pressure on the dollar, GBP/USD has returned to 1.3500; the pair extended its modest intraday rebound from a one-week low in early European trading on Monday, regaining the psychological level of 1.3500. Spot prices have now filled the bearish gap from this week and appear poised for further gains with a renewed wave of dollar selling. Despite renewed tensions between the US and Iran over the Strait of Hormuz, the safe-haven dollar has struggled to capitalize on its earlier gains to a one-week high, as the probability of a Fed rate hike has decreased. This diverges significantly from the Bank of England's outlook, which is likely to continue providing tailwinds for the pound, validating the positive outlook for GBP/USD. Furthermore, the US-Iran conflict will put significant pressure on the UK economy, pushing up borrowing costs and inflation, while dampening growth prospects ahead of the April 30 policy meeting. Nevertheless, recent data suggests strong pre-war economic momentum, with GDP growing by 0.5% in February. The pound remains near an eight-week high, having risen by about 2.6% in April, hoping for a peace agreement.
Market participants have increased their bets on a Bank of England tightening policy, anticipating about three 25-basis-point rate hikes in 2026, possibly starting in April, as inflation concerns have resurfaced. This diverges significantly from the Fed's expectations and validates the short-term outlook for GBP/USD. A positive outlook. The overnight break above the psychological level of 1.3500, coupled with the recent break above the 100-day simple moving average (SMA) at 1.3453 on the daily chart, is favorable for GBP/USD bulls. Furthermore, a positive MACD reading indicates solid upward momentum. However, the Relative Strength Index (RSI) is near 60, suggesting it's approaching overbought territory, which could slow the rally rather than lead to an immediate reversal. On the upside, initial resistance is seen at 1.3599 (last week's high) and the psychological level of 1.3600. Immediate support is seen at the 100-day SMA at 1.3453 and the psychological level of 1.3500.
Consider going long GBP at 1.3523 today, with a stop-loss at 1.3510 and a target of 1.3580. 1.3570
USD/JPY
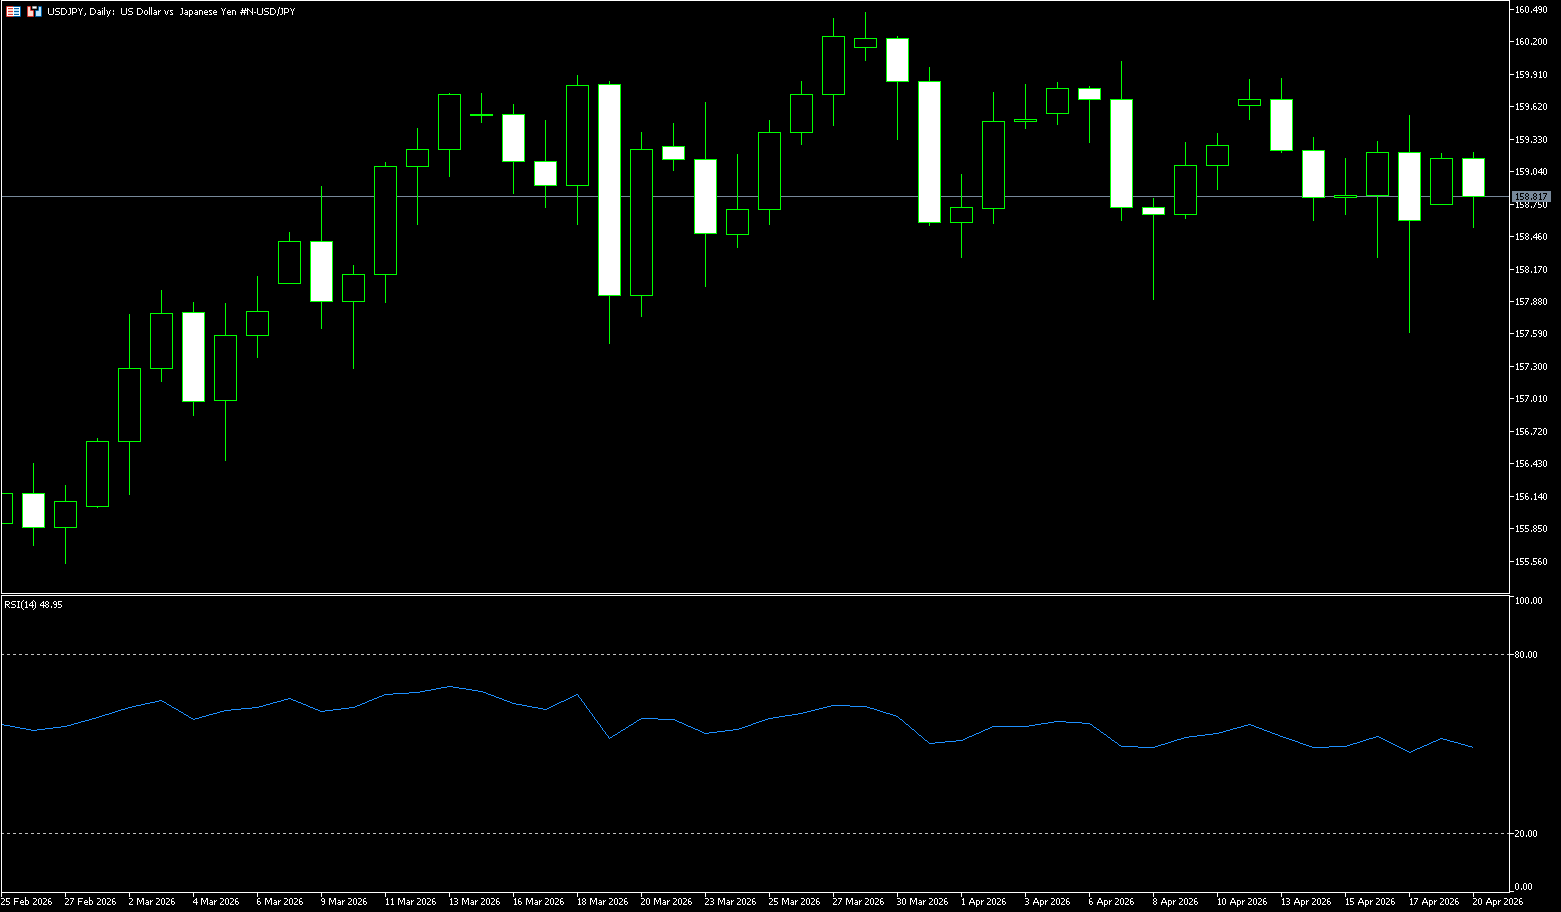
The USD/JPY pair maintained a positive trend around 159.00 in early Asian trading on Monday. The dollar strengthened against the yen as tensions between the US and Iran escalated again after more than seven weeks of conflict in the Middle East. Iran denied it would participate in a new round of peace talks with the US, after US President Donald Trump stated that Iranian negotiators would travel to Pakistan on Monday for a second round of peace talks. Trump claimed the US Navy fired on and seized a cargo ship flying the Iranian flag, while Tehran warned that ships approaching the strait would be considered violators of the ceasefire agreement. Several ships were forced to abandon their passage hours after Tehran announced the strait was open. The escalating tensions between the US and Iran may provide some support for the dollar against the yen in the short term. Given Japan's heavy reliance on Middle Eastern oil imports, this situation exacerbates market concerns about its economic prospects, thus weakening the yen's appeal. Investors are worried that rising energy costs could weaken the yen. Fundamental support beyond safe-haven appeal has weakened significantly. Against this backdrop, USD/JPY has gained some upward momentum.
On the daily chart, a clear break below and hold below the 50-day simple moving average (157.67) would give buyers room to hold the recent consolidation bottom, exposing a greater risk of correction. However, as long as USD/JPY holds above this moving average, the fundamental bias remains moderately bullish, and any attempt to bounce off current levels is likely to be seen as a continuation of the existing uptrend rather than the start of a sustained reversal. The Moving Average Convergence Divergence (MACD) indicator has slipped into negative territory and continues to decline. Furthermore, the Relative Strength Index (RSI) is around 50, hovering in neutral territory, suggesting weakening momentum and reduced buyer control. This further suggests that it is prudent to wait cautiously before making new bearish bets until a clear downtrend is established in the USD/JPY exchange rate structure. Support levels to watch are 158.00 (a psychological level). And the 50-day simple moving average is 157.67. As for the upward direction, pay attention to the key resistance level of 160, a psychological level; a break above this level would target the 160.35 area (April 2024 high) and the 161.29 area (June 2024 high).
Today, consider shorting the US dollar at 158.98, with a stop loss at 159.20 and a target of 158.00. 158.20
EUR/USD
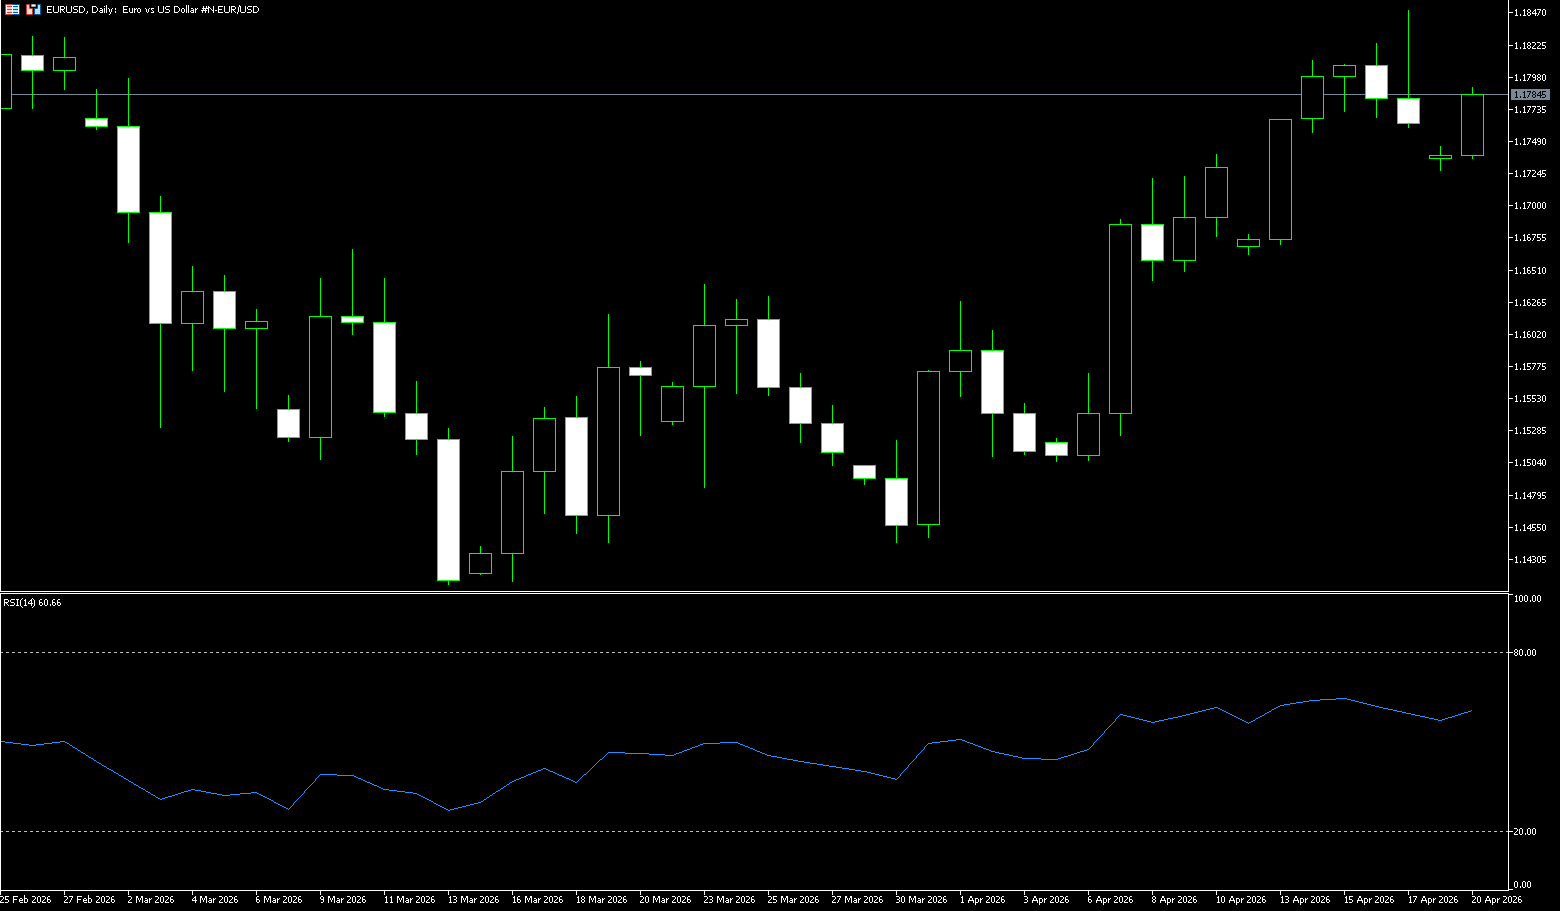
The euro/dollar pair opened lower but rebounded slightly, remaining in negative territory, trading around 1.1780 during Monday's European session. The pair was pressured by renewed tensions between the US and Iran, which weighed on the dollar due to increased safe-haven demand. Iran's state media, the Islamic Republic News Agency (IRNA), reported that Tehran refused to resume negotiations with US officials, citing issues including "unrealistic expectations." Iran has blocked the Strait of Hormuz since the US-Israel attacks on February 28. Although authorities briefly indicated on Friday that they would reopen it, they reversed the decision on Saturday after US President Trump refused to lift the blockade of the Iranian port. The dollar strengthened as markets anticipated the Federal Reserve would maintain a "higher and longer" policy stance, driven by persistent inflation and Middle East tensions. Additionally, the euro received support as traders increased bets on a possible European Central Bank rate hike this year. The renewed blockade of the Strait of Hormuz has dampened optimism about the normalization of energy supplies from major Middle Eastern oil producers and exacerbated concerns about stagflation in the eurozone.
From a technical perspective, the four-hour chart shows the EUR/USD pair in a short-term bullish trend, as the price has clearly stabilized above its key moving averages. The 20-period simple moving average (SMA) at 1.1787 provides the first layer of dynamic support, while the 100-period and 200-period SMAs are at lower levels, suggesting a solid upward trend on the basis. Momentum indicators remain constructive, rising within positive territory, while the 14-period Relative Strength Index (RSI) hovers around 46, indicating that selling pressure remains. On the daily chart, the EUR/USD pair is in a bullish trend, rising for the seventh consecutive day. The spot price is above the 100-day and 200-day SMAs, while the shorter-term 20-day SMA is at 1.16373, below both. Momentum indicators support further gains, while the RSI is at 60, significantly high, indicating that buying pressure still dominates for the time being. Immediate resistance is located around 1.1830, which is the high point of the pair at the end of February. After the breakout, the next resistance is at 1.1900. Initial support is seen at the 100-day simple moving average of 1.1705, while the psychological level of 1.1700 strengthens the deeper demand area; if the current rally pauses or retraces, buyers are expected to re-enter this area.
Consider going long on the Euro today at 1.1775, with a stop-loss at 1.1763 and targets at 1.1830 and 1.1820.
Disclaimer: The information contained herein (1) is proprietary to BCR and/or its content providers; (2) may not be copied or distributed; (3) is not warranted to be accurate, complete or timely; and, (4) does not constitute advice or a recommendation by BCR or its content providers in respect of the investment in financial instruments. Neither BCR or its content providers are responsible for any damages or losses arising from any use of this information. Past performance is no guarantee of future results.
Lebih Liputan


Pendedahan Risiko:Instrumen derivatif diniagakan di luar bursa dengan margin, yang bermakna ia membawa tahap risiko yang tinggi dan terdapat kemungkinan anda boleh kehilangan seluruh pelaburan anda. Produk-produk ini tidak sesuai untuk semua pelabur. Pastikan anda memahami sepenuhnya risiko dan pertimbangkan dengan teliti keadaan kewangan dan pengalaman dagangan anda sebelum berdagang. Cari nasihat kewangan bebas jika perlu sebelum membuka akaun dengan BCR.
BCR Co Pty Ltd (No. Syarikat 1975046) ialah syarikat yang diperbadankan di bawah undang-undang British Virgin Islands, dengan pejabat berdaftar di Trident Chambers, Wickham’s Cay 1, Road Town, Tortola, British Virgin Islands, dan dilesenkan serta dikawal selia oleh Suruhanjaya Perkhidmatan Kewangan British Virgin Islands di bawah Lesen No. SIBA/L/19/1122.
Open Bridge Limited (No. Syarikat 16701394) ialah syarikat yang diperbadankan di bawah Akta Syarikat 2006 dan berdaftar di England dan Wales, dengan alamat berdaftar di Kemp House, 160 City Road, London, City Road, London, England, EC1V 2NX. Entiti ini bertindak semata-mata sebagai pemproses pembayaran dan tidak menyediakan sebarang perkhidmatan perdagangan atau pelaburan.

 English
 简体中文
简体中文
 繁體中文
繁體中文
 Bahasa
Melayu
Bahasa
Melayu
 Tiếng
Việt
Tiếng
Việt
 ไทย
ไทย
 日本語
日本語
 한국어
한국어
 ភាសាខ្មែរ
 español