


0
US Dollar Index
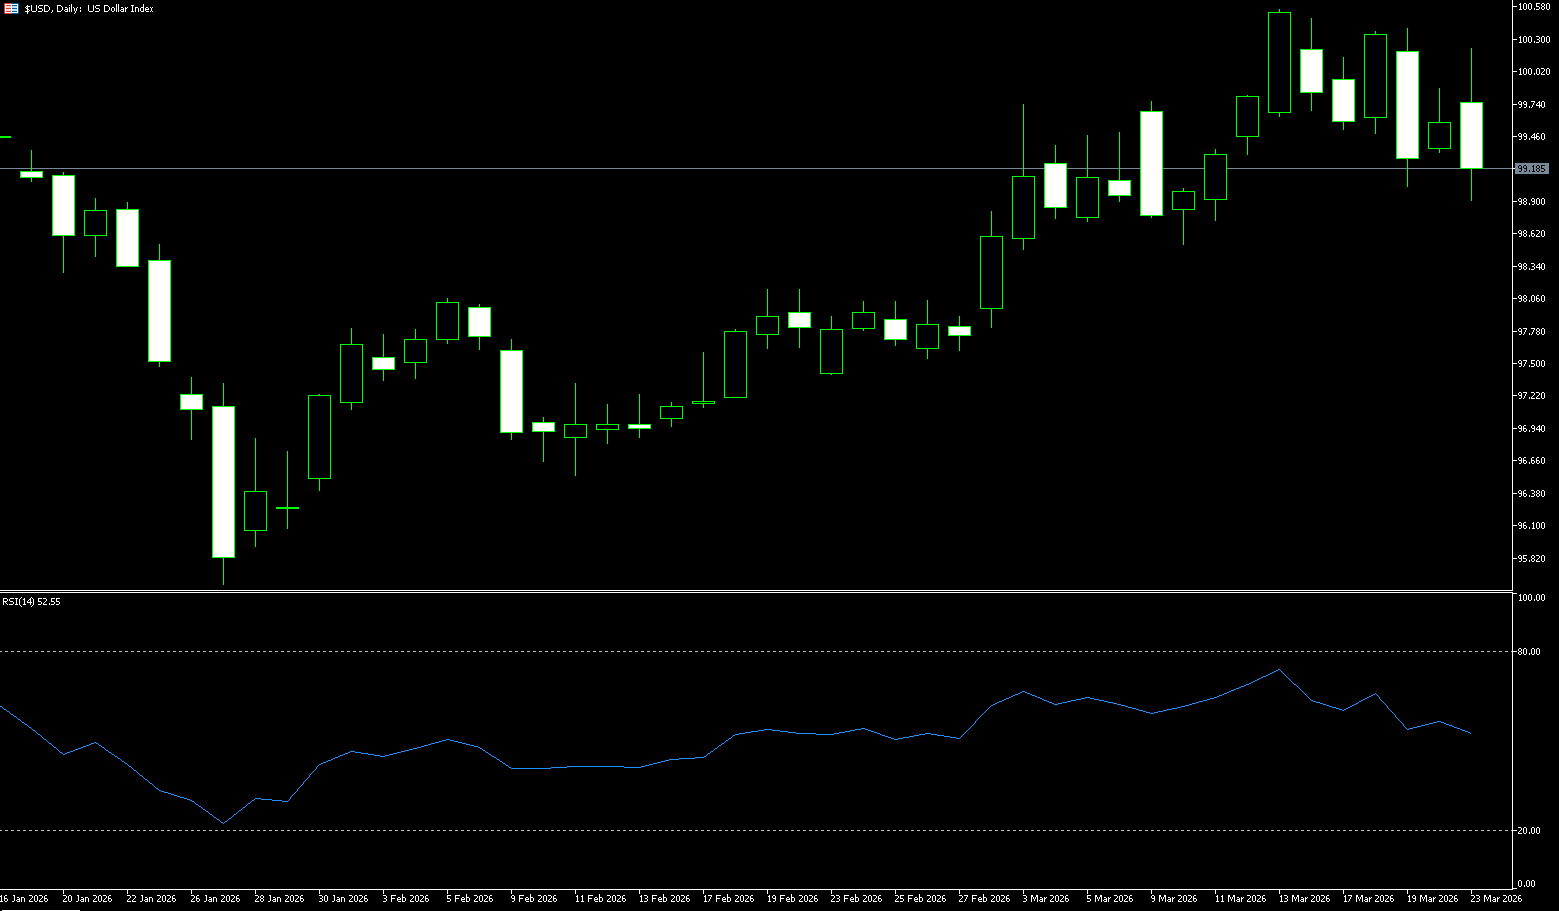
The US dollar index climbed above 100 early in the week, extending gains from the previous trading day, as escalating tensions in the Middle East increased safe-haven demand for the currency. Subsequently, US President Trump instructed the War Department to postpone any and all military strikes against Iranian power plants and energy infrastructure for five days, depending on the effectiveness of ongoing meetings and discussions. The immediate market reaction to the dollar index was a drop from 100.15 to 98.88, last trading around 99.10, after Tehran warned that it would target key US and Israeli assets in the region if its energy facilities were attacked. High oil prices continue to exacerbate inflation concerns and reduce the likelihood of a near-term Fed rate cut; some traders now expect a rate hike by the end of the year. The European Central Bank, the Bank of England, and the Bank of Japan also kept interest rates unchanged but indicated they were prepared to tighten policy further if inflationary pressures persist.
The dollar rose on Friday but is still on track for a weekly decline against major currencies. Rising energy prices and inflation have led investors to reduce their bets on a Federal Reserve rate cut. After two consecutive weeks of gains, the dollar reversed sharply, with the dollar index briefly testing levels below 99.00 over the weekend after firmly establishing itself above 100.00. At first glance, this move seems somewhat unusual. U.S. Treasury yields have been rising at both the short and mid-range of the curve, especially after the Fed meeting. Normally, such interest rate dynamics would support the dollar, not drag it down. This divergence is significant. The dollar is no longer simply trading on interest rates, but is navigating a more complex landscape of positioning, expectations, and geopolitical factors. On the upside, watch the 100 (psychological level) and the 100.43 (last week's high) area. On the downside, watch the 99 level (a psychological level); a break below this level would likely lead to a pullback to the 98.98 (last week's low) - 98.55 (134-day simple moving average) support zone.
Consider shorting the US Dollar Index today at 99.25, with a stop-loss at 99.40 and targets at 98.80 and 98.70.
WTI Crude Oil
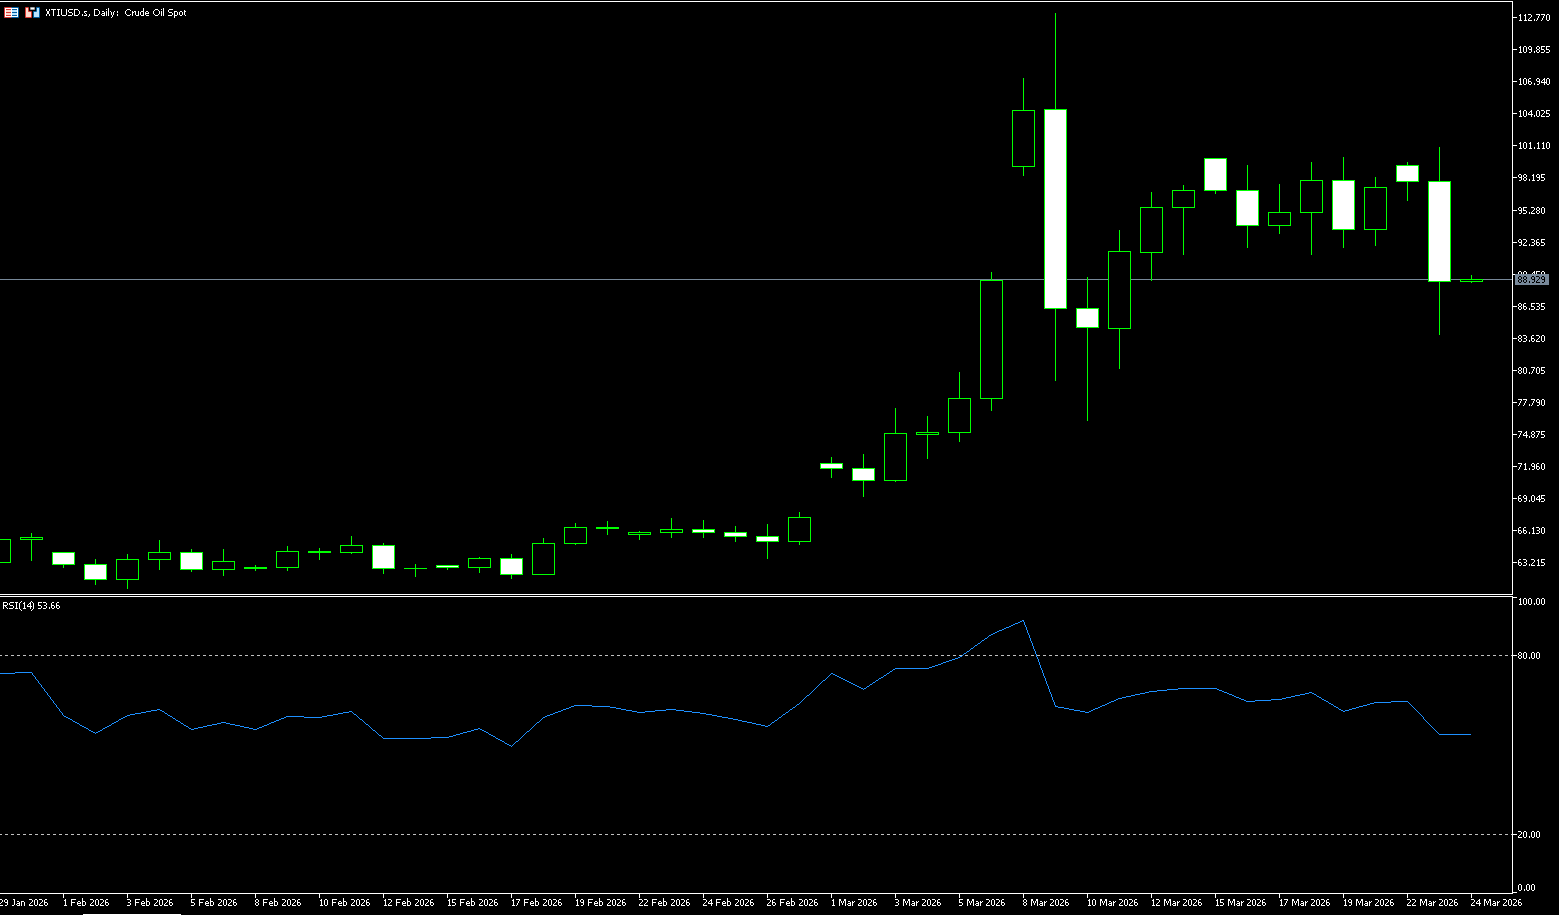
WTI Spot crude oil prices plunged more than 10% on Monday, falling to around $87.60 a barrel, after President Trump ordered a five-day halt to planned U.S. strikes on Iranian energy infrastructure, signaling a de-escalation. This move followed what Trump called constructive talks with Iran aimed at resolving the conflict, with discussions set to continue this week. The announcement eased supply concerns stemming from the U.S. deadline for reopening the Strait of Hormuz, a key global oil shipping route. Markets reacted sharply as the risk of further disruption to energy infrastructure temporarily diminished, and focus shifted to whether diplomatic efforts could lead to a sustained reopening of the critical waterway. However, Iran's Fars News Agency denied... Any negotiations are seen as Trump's actions stemming from Iran's threat to attack all power plants in West Asia.
Overall, this week's oil market pricing power was entirely driven by geopolitical tensions. The US release of oil already en route was interpreted by the market as a "drop in the bucket." Operationally, oil prices have entered technically overbought territory, and short-term caution is advised regarding potential pullbacks due to risk aversion. Technically, WTI crude oil's wide consolidation this week between $83.80 (20-day simple moving average) and $107.96 (upper Bollinger Band on the daily chart) reflects the extreme nature of supply risks from non-US regions. The moving average system shows a typical bullish alignment, but the MACD histogram is shortening, indicating that the high-level momentum is nearing its end. The Bollinger Band is in a state of extreme expansion. The exchange rate is trading near the upper Bollinger Band, indicating continued high volatility in the short term. On the upside, watch the psychological level of $100 and the $107.96 area (the upper Bollinger Band on the daily chart). On the other hand, a break below the $90.00 support level (a key market level) would target further resistance at $84.00 (Monday's low) and the $80.00 psychological level.
Today, consider going long on spot crude oil at $87.40, with a stop-loss at $87.10 and targets at $90.00 and $92. 00
Spot Gold
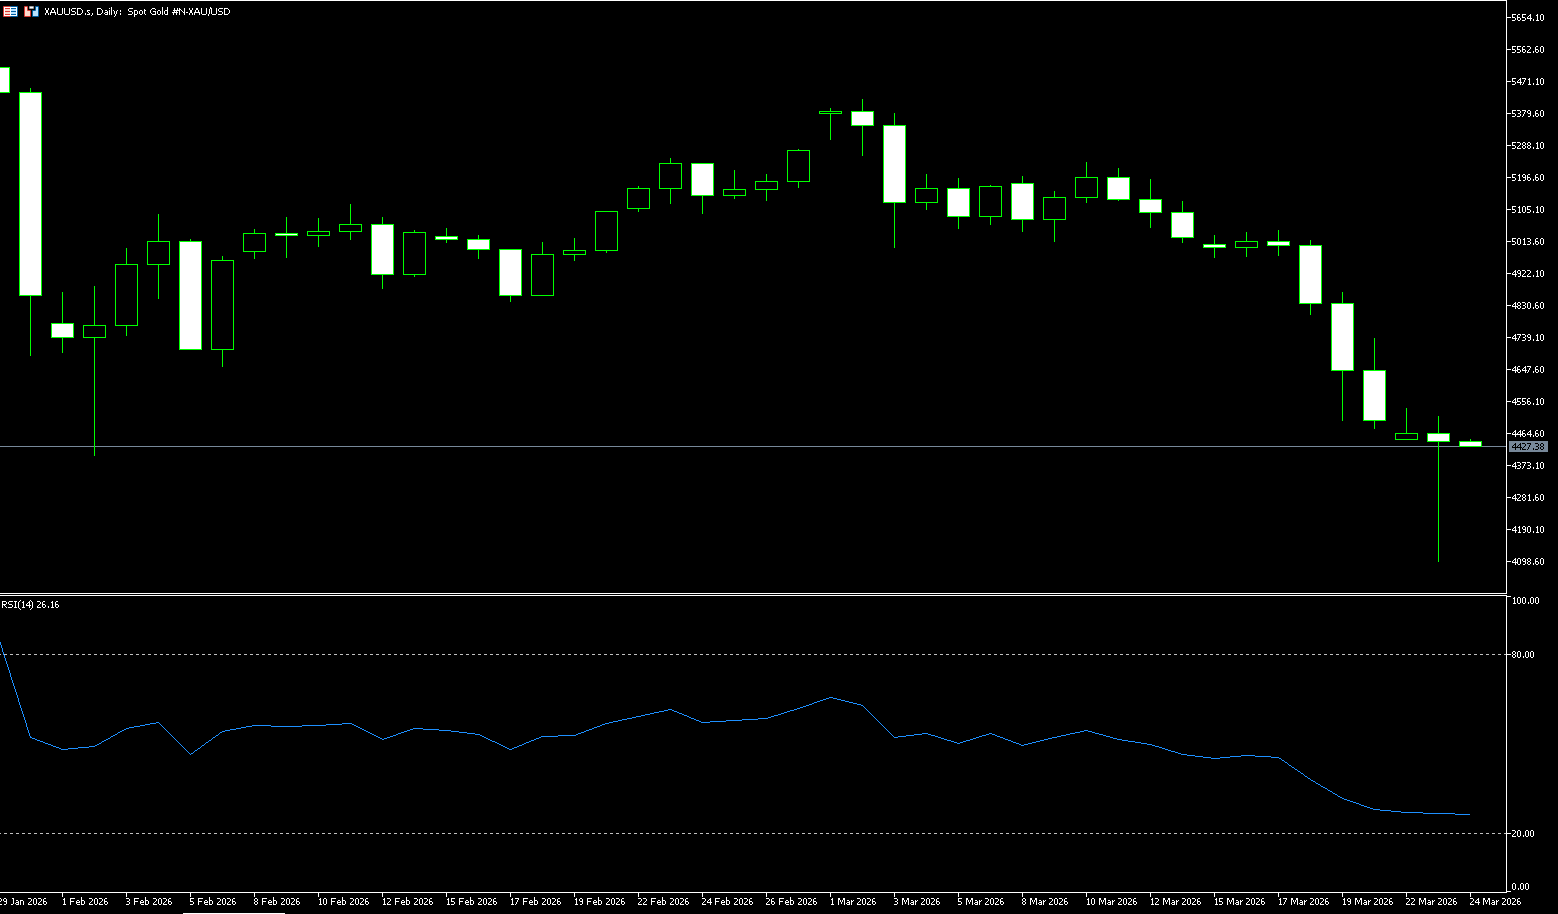
Gold fell as much as 8% on Monday, dropping below $4,100 an ounce to its lowest level in four months, as escalating conflict in the Middle East fueled inflation concerns, while major economies faced pressure to increase liquidity through means such as gold sales to offset the effects of the war. The metal initially fell to its lowest level since January as soaring oil prices and hawkish central bank signals shifted the market narrative toward a stagflation shock. However, gold recovered from early losses as easing tensions reduced pressure on non-yielding assets from soaring Treasury yields. This development suggests the US government is... Measures have been taken to limit the surge in energy prices that have led to a collapse in global risk appetite. Therefore, the safe-haven premium remains supported by conflicting reports on the Strait of Hormuz and the potential joint control of the waterway.
On Monday, during the Asian and European trading sessions, spot gold experienced an extreme price action, briefly surging before plummeting. After a slight rebound of only 0.5% at the open, it immediately began a sustained decline, with the intraday drop reaching as high as 8.27% {4098}, pushing market panic selling to its peak. The market had already priced in the upward shift in global inflation caused by escalating geopolitical conflicts, resulting in gold's most dramatic single-day reversal in years, catching global investors off guard. Looking at the daily chart for gold, the beginning of the week signaled increased short-term selling pressure. Currently... Gold prices attempted to stabilize above $4,095 (the 200-day simple moving average) and $4,098 (Monday's low), signaling increased short-term selling pressure. The 14-day Relative Strength Index (RSI) hovered around 24, in oversold territory, but the current bearish momentum remains strong. If gold prices break below the $4,098-$4,095 area again, the next support level will test $4,000 (the psychological low). However, if gold prices remain weak and volatile, there is a chance for further pullback to around $3,800. If gold prices can hold above $4,098-$4,095, a technical rebound is expected, with the first resistance level at $4,402 (the February 2nd low) and $4,500 being a key level for a potential reversal. A break below this level would target the $4,600 mark.
Today, consider going long on spot gold at $4,395, with a stop-loss at $4,385 and a target of $4,500. 4,550
AUD/USD
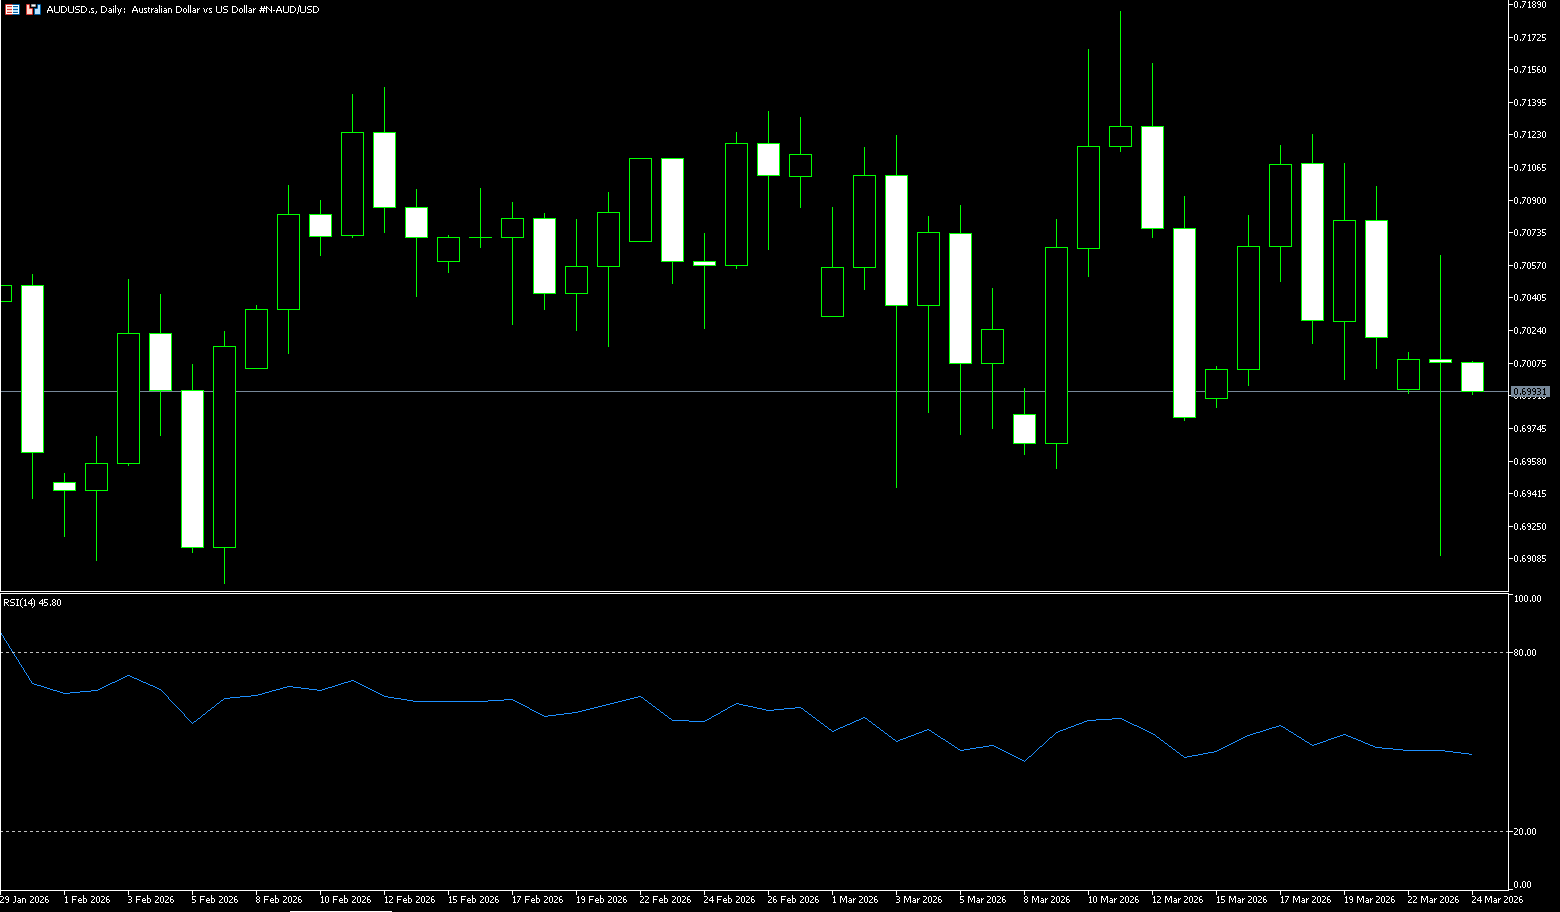
The Australian dollar initially weakened to around US$0.69 early in the week, extending last week's losses and reaching its lowest level in eight weeks, as a stronger US dollar and falling Asian stocks pressured the risk-sensitive currency. Later, the pair rebounded above 0.70 after US President Trump instructed the War Department to postpone a military strike on Iranian power plants, as the US dollar received broad support from safe-haven demand amid escalating tensions in the Middle East. The decline in Asian stocks further pressured the Australian dollar, reflecting concerns about the potentially broader economic impact of the Middle East conflict, which dampened demand for the commodity-linked Australian dollar. Domestically, investors are now awaiting Wednesday's inflation data after the Reserve Bank of Australia narrowly approved a rate hike to 4.1%. This marks the first consecutive rate hikes since mid-2023 and reverses two of the three rate cuts last year.
From a technical perspective, the AUD/USD pair has retreated below the slowly rising 20-day moving average (0.7067) on the daily chart, indicating a mildly bearish bias in the short term, suggesting weakening momentum after last week's attempt to rally above 0.7100 stalled. The Moving Average Convergence Divergence (MACD) indicator has broken below the signal line and fallen below zero, accompanied by a moderately negative histogram, indicating that bearish momentum is rebuilding after a brief period of equilibrium. Furthermore, the 14-day Relative Strength Index (RSI) is near 42, below the 50 midline but not yet in oversold territory, reinforcing the downward bias, but there is still room for further weakness before signs of further weakening emerge. On the upside, near-term resistance is located around the 20-day moving average at 0.7064. A sustained rise and break above this resistance would alleviate current bearish pressure and pave the way for a challenge of 0.7100. On the downside, watch the 0.6900 level (psychological level), followed by the 0.6834 level (January 23 low).
Today, consider going long on the Australian dollar at 0.7000, with a stop-loss at 0.6985 and targets at 0.7060 and 0.7070.
GBP/USD
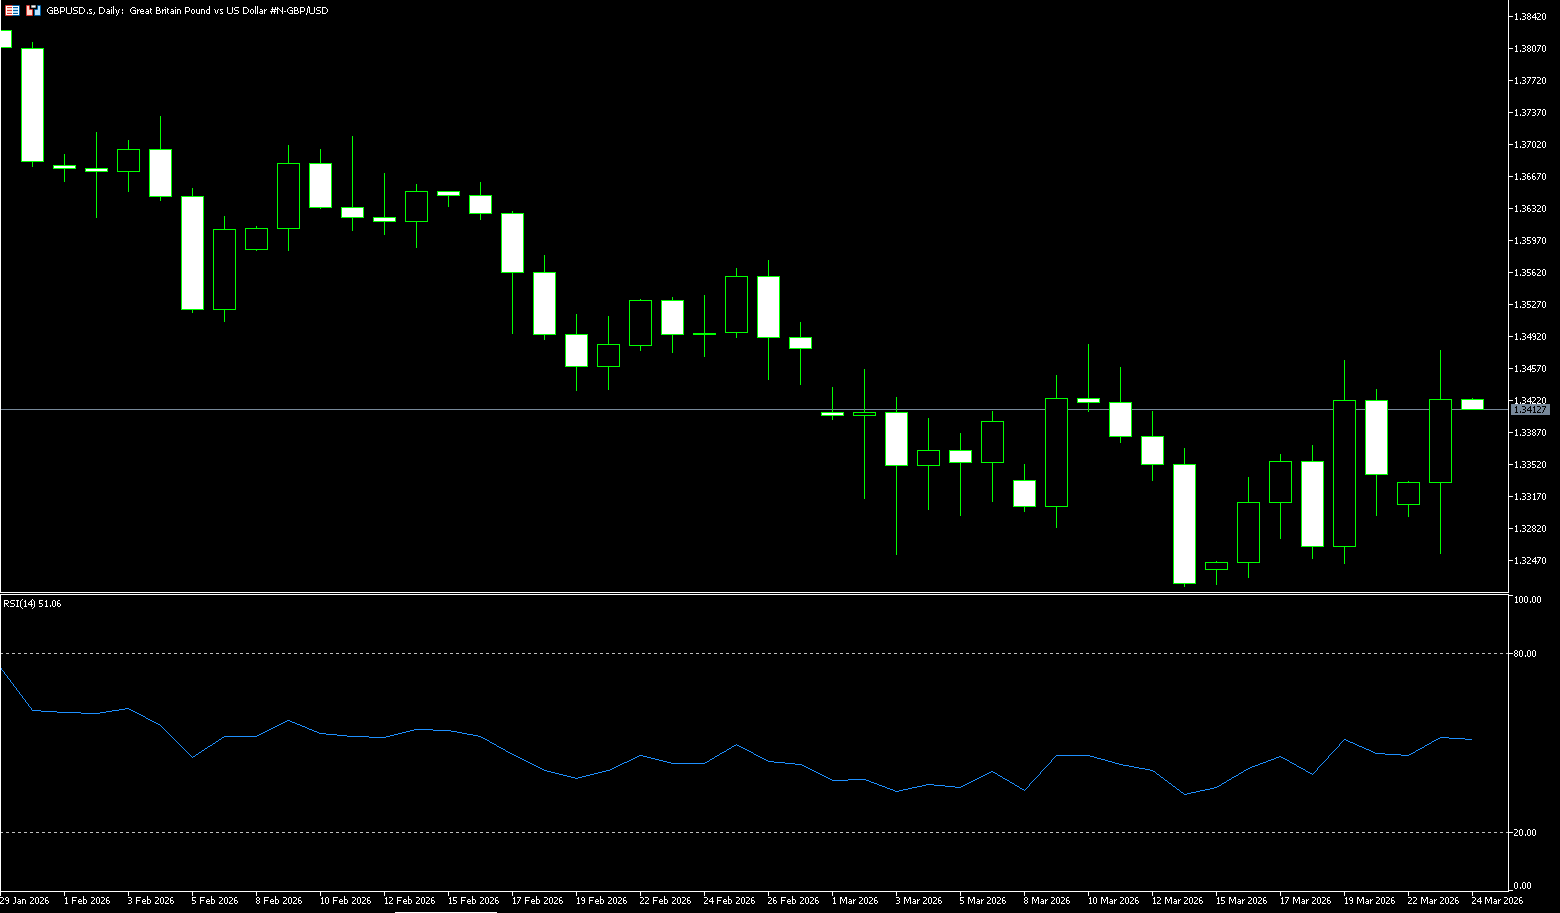
The GBP/USD pair rebounded to near 1.34 during Monday's European trading session, pressured by a stronger dollar following President Trump's instruction to the War Department to postpone military strikes against Iranian power plants. However, escalating conflict in the Middle East pushed Brent crude oil prices above $100 per barrel. This triggered concerns about stagflation in the UK and put pressure on the pound against the dollar. The Bank of England, as widely expected, kept interest rates at 3.75% at its monthly meeting last Wednesday. Bank of England Governor Andrew Bailey stated that the Middle East conflict would have a "shock" to the economy, pushing up inflation in the short term, adding that restoring safe shipping in the Strait of Hormuz was key to addressing rising energy prices. Meanwhile, Geopolitical risks persist, potentially limiting further losses for the safe-haven dollar and helping to suppress the GBP/USD pair. Therefore, market focus remains on developments related to the Iraq War, with traders awaiting macroeconomic data from the US and UK this week for short-term opportunities.
On the daily chart, GBP/USD is mildly bearish in the short term, with the spot price holding below the flattening 200-day simple moving average at 1.3433 and trading below the Bollinger Band middle line at 1.3387, limiting price action to the lower half of its trading range. The 14-day RSI is around 46, reinforcing the weakening bullish momentum rather than significant selling pressure, indicating that sellers still have the upper hand, but the decline is restrained rather than impulsive. Near-term support lies near the March 17 low of 1.3273; a break below this area would expose the next support level around the psychological level of 1.3200. Initial resistance is located at the 200-day simple moving average at 1.3433 and the 1.3450 area. A daily close above this resistance level would help neutralize bearish sentiment and pave the way for a further push towards the 1.3500 level.
Consider going long on GBP at 1.3420 today, with a stop loss at 1.3400 and targets at 1.3480 and 1.3500.
USD/JPY
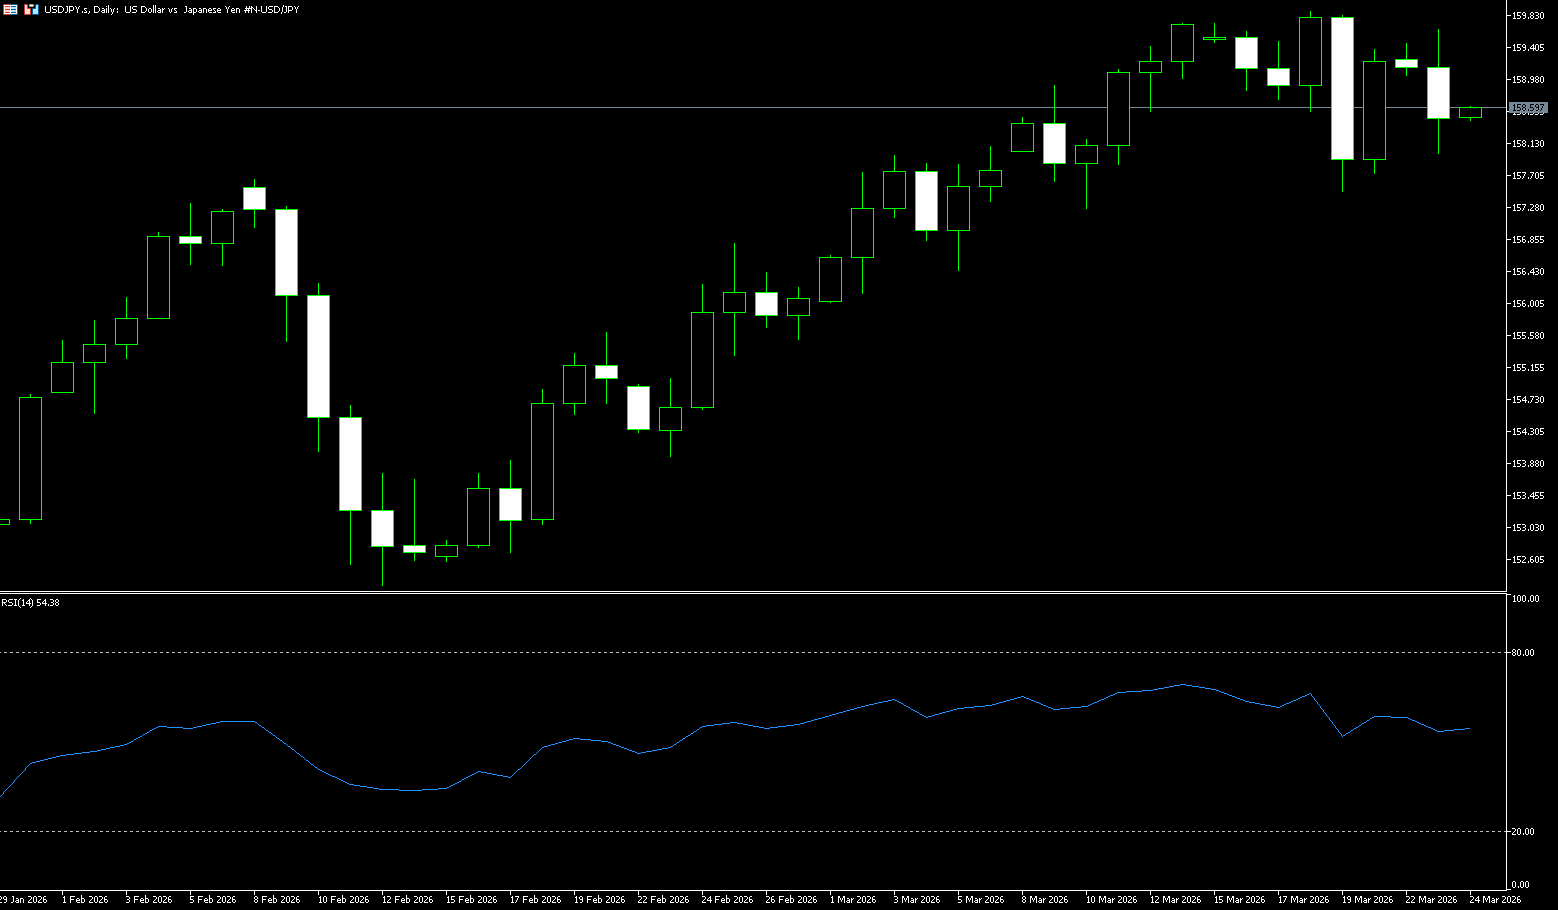
The yen depreciated to 160.50 against the dollar on Monday, breaking through the key 160 level that had previously triggered market intervention. Chief Monetary Officer Atsushi Mimura stated that the government is prepared to take all necessary measures to address foreign exchange volatility. Mimura also emphasized the impact of the ongoing Middle East conflict and rising oil prices on the yen, noting that currency fluctuations affect people's daily lives. The yen failed to maintain last week's gains when the Bank of Japan kept its policy rate unchanged but hinted at a tendency to tighten monetary policy to combat inflationary pressures from soaring oil prices. Board member Hajime Takada dissented, recommending a second consecutive 25 basis point rate hike to [missing information]. 1%. Bank of Japan Governor Kazuo Ueda added that an interest rate hike is still possible if the economic slowdown caused by the Iranian conflict proves to be temporary.
The USD/JPY pair once again validated its status as a key psychological support level. Yesterday, it briefly broke through the 160 psychological barrier, reaching 160.50, before returning to around 159.50 following reports of anticipated Bank of Japan intervention. The official stance that the yen's weakness is primarily due to imported inflation not only limits the dollar's upside potential but also shifts market attention to a correction in this month's gains. The USD/JPY pair is expected to maintain a high-level, slightly bullish trend this week, with bulls dominating but facing resistance from both the 160 level (anticipated Japanese intervention) and 160.50 (Monday's high). Technical indicators... The daily RSI (14) remains around 55-60, neutral to slightly bullish, with no obvious overbought divergence, indicating further room for bullish momentum. The MACD lines are running above the zero line, with the red bars showing moderate expansion, confirming bullish dominance. The 157.00 (psychological level) - 157.50 (last week's low) level provides strong short-term support, as the USD/JPY interest rate differential and hawkish expectations from the Fed provide strong bottom support. On the upside, watch the psychological levels of 159.50 and 160.
Today, consider shorting the USD at 158.60, with a stop loss at 158.90 and targets at 157.50 and 157.30.
EUR/USD
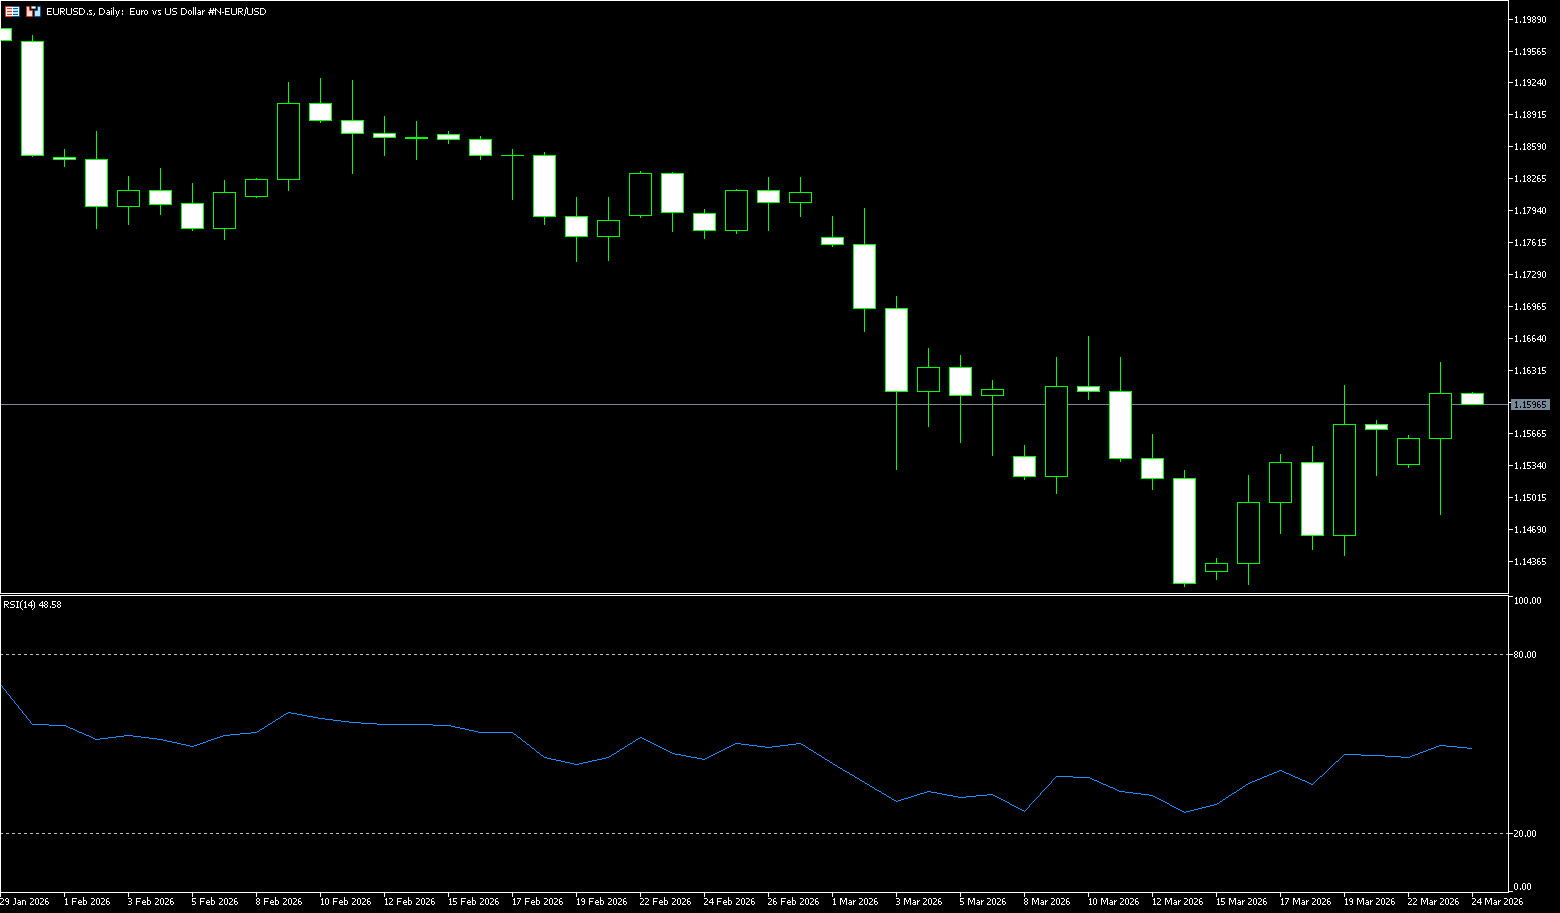
After a volatile week, the Euro... The euro/dollar pair initially fell to around $1.1550, as investors flocked to the dollar due to concerns about an energy shock triggered by the Iranian conflict, exacerbating inflation fears. The euro/dollar pair rebounded sharply after breaking below 1.1500 earlier in the day, turning positive above 1.16. Improved risk sentiment following President Trump's decision to postpone attacks on Iran's power infrastructure made it difficult for the dollar to command demand, further boosting the pair. On the other hand, Money markets now expect the ECB to raise interest rates at least twice in 2026, and possibly a third time. The central bank kept rates unchanged on Thursday but raised its inflation forecasts while lowering its growth projections, citing increased risks from the Middle East crisis. ECB policymaker Joachim Nagel said a rate hike could be possible next month if price pressures persist, while François Villeroy de Galhau emphasized the central bank's readiness to act decisively.
The euro/dollar pair recovered its intraday losses after a gap down opening, trading near 1.16 on Monday. Daily chart technical analysis shows the pair is testing the upper trendline of a descending channel. There are potential bullish reversal signals. The price action is mixed, trading above the 9-day simple moving average (1.1522) but below the 50-day simple moving average (1.1727). This suggests short-term bullish momentum, but the overall trend remains bearish, and gains may be limited unless the price clearly breaks above the medium-term moving average. The 14-day Relative Strength Index (RSI) momentum indicator is 43, below the 50 midline, indicating continued selling pressure. EUR/USD is testing immediate resistance at 1.1600. A break above this level would strengthen the market bias, supporting the pair near the 30-day simple moving average at 1.1688. And the 1.1700 level. Immediate support lies at the psychological level of 1.1500. A break below this level would strengthen the bearish bias, exerting downward pressure and testing the 7-month low of 1.1411 reached on March 13th.
Consider going long on the Euro today at 1.1595, with a stop-loss at 1.1580 and targets at 1.1650 and 1.1670.
Disclaimer: The information contained herein (1) is proprietary to BCR and/or its content providers; (2) may not be copied or distributed; (3) is not warranted to be accurate, complete or timely; and, (4) does not constitute advice or a recommendation by BCR or its content providers in respect of the investment in financial instruments. Neither BCR or its content providers are responsible for any damages or losses arising from any use of this information. Past performance is no guarantee of future results.
Lebih Liputan


Pendedahan Risiko:Instrumen derivatif diniagakan di luar bursa dengan margin, yang bermakna ia membawa tahap risiko yang tinggi dan terdapat kemungkinan anda boleh kehilangan seluruh pelaburan anda. Produk-produk ini tidak sesuai untuk semua pelabur. Pastikan anda memahami sepenuhnya risiko dan pertimbangkan dengan teliti keadaan kewangan dan pengalaman dagangan anda sebelum berdagang. Cari nasihat kewangan bebas jika perlu sebelum membuka akaun dengan BCR.
BCR Co Pty Ltd (No. Syarikat 1975046) ialah syarikat yang diperbadankan di bawah undang-undang British Virgin Islands, dengan pejabat berdaftar di Trident Chambers, Wickham’s Cay 1, Road Town, Tortola, British Virgin Islands, dan dilesenkan serta dikawal selia oleh Suruhanjaya Perkhidmatan Kewangan British Virgin Islands di bawah Lesen No. SIBA/L/19/1122.
Open Bridge Limited (No. Syarikat 16701394) ialah syarikat yang diperbadankan di bawah Akta Syarikat 2006 dan berdaftar di England dan Wales, dengan alamat berdaftar di Kemp House, 160 City Road, London, City Road, London, England, EC1V 2NX. Entiti ini bertindak semata-mata sebagai pemproses pembayaran dan tidak menyediakan sebarang perkhidmatan perdagangan atau pelaburan.

 English
 简体中文
简体中文
 繁體中文
繁體中文
 Bahasa
Melayu
Bahasa
Melayu
 Tiếng
Việt
Tiếng
Việt
 ไทย
ไทย
 日本語
日本語
 한국어
한국어
 ភាសាខ្មែរ
 español

