

0
US Dollar Index
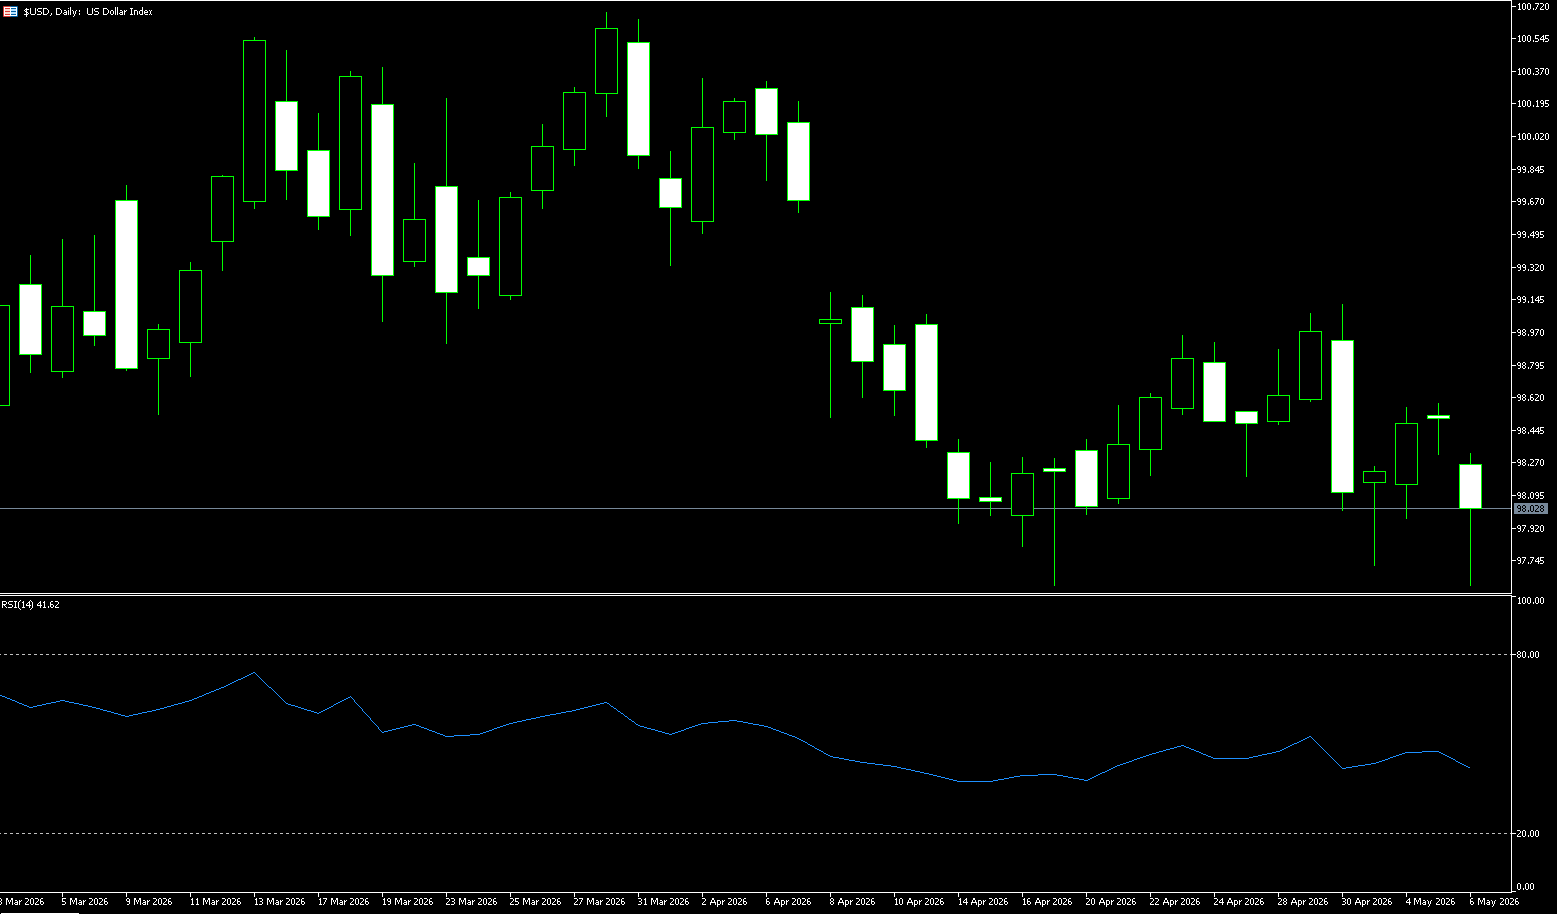
The US dollar index fell below 98 on Wednesday, ending a three-day rally, as optimism about a possible agreement between Washington and Tehran reduced demand for the currency's safe-haven appeal. Defense Secretary Hergesses stated that the ceasefire, which began nearly a month ago, remains in effect, and Secretary of State Rubio confirmed that offensive operations have ended, with Washington shifting its focus to protecting shipping routes in the Strait of Hormuz. President Trump also announced a temporary suspension of US-led efforts to help stranded ships leave the Strait of Hormuz to allow time for renegotiation with Tehran. Lower oil prices eased inflation concerns and reduced market expectations that the Federal Reserve might need to raise interest rates to curb price pressures. Market participants are now turning their attention to Friday's more closely watched monthly jobs report.
The US dollar index is currently trading almost entirely above its 100-day (98.47) and 200-day (98.55) simple moving averages. These levels are currently acting as some resistance, reflecting market reluctance to add to dollar positions. Given that these gains could be quickly reversed, the market seems reluctant to push the dollar higher again. Looking at the daily chart, the dollar index has entered a clear range-bound trading pattern since its high of 100.64. Currently, the index is below the 200-day simple moving average (98.55), suggesting that volatility may be about to increase. The MACD indicator shows signs of a short-term golden cross, but overall it remains in a weak range. In terms of candlestick patterns, the consecutive candlesticks with upper and lower shadows from late April to early May reflect that the bulls attempted a rebound but encountered resistance and fell back, while the bears found some buying support near the 98 level. A break below this level would target 97.62 (the low of May 6th) and the 87.50 level. Resistance levels are at the 200-day simple moving average (98.55) and near 98.88 (the high of April 28th).
Today, consider shorting the US Dollar Index at 98.13, with a stop-loss at 98.25 and targets at 97.70 and 97.60.
WTI Crude Oil
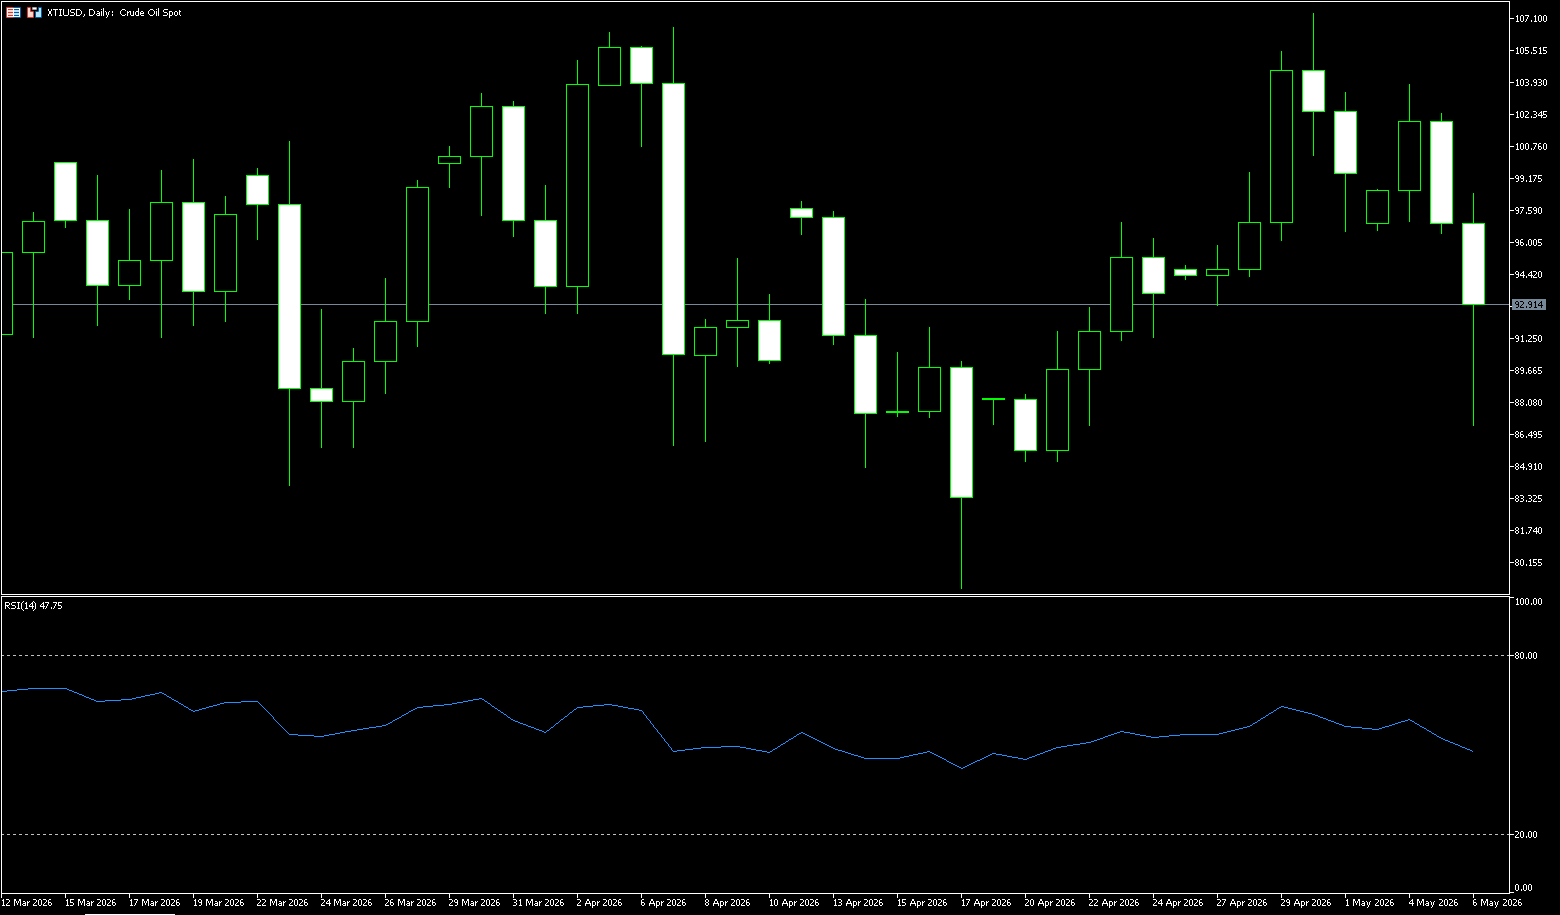
On Wednesday (May 6), news of significant progress in US-Iran negotiations caused international oil prices to plummet, quickly diminishing the geopolitical risk premium accumulated earlier due to tensions in the Strait of Hormuz. By the European trading session on May 6, Brent crude futures prices had plunged more than 9%, briefly falling to near the key psychological level of $102, while WTI spot prices fell below $100, experiencing their largest drop in over 10% in a single day, reaching a low of $90.05 per barrel. The US and Iran are close to reaching a one-page ceasefire memorandum, the closest they have come to a peace agreement since the outbreak of hostilities. The memorandum contains 14 core provisions, the core of which is that Iran will suspend uranium enrichment activities, the US will lift sanctions on Iran and unfreeze billions of dollars in frozen assets, and both sides will simultaneously lift restrictions on passage through the Strait of Hormuz. The US expects Iran to issue a formal response on several key differences within the next 48 hours. Although no final agreement has been reached, negotiations have entered a substantive phase.
In summary, the current decline in oil prices is more of a correction in sentiment due to easing geopolitical risks than a weakening of fundamentals. Continued inventory declines and tight global supply remain important supporting factors for oil prices. Future market trends will depend on two core variables: whether the situation in the Middle East truly stabilizes, and whether the inventory decline trend continues. Overall, the market is in a complex pattern of "short-term pressure and medium-term strength," with volatility expected to remain high. From a technical perspective, WTI's daily chart still maintains a medium-term upward channel, but momentum has weakened. The current price is fluctuating slightly below $100. Short-term moving averages are beginning to flatten, indicating a near balance between bullish and bearish forces. The MACD indicator has shown a slight death cross, suggesting short-term downward pressure, but if the price can stabilize above $100, there is still a possibility of retesting the $105 level and the $107.35 level (the May high). Short-term support levels are at $90.00 (a psychological level) and $85.00.
Consider going long on crude oil today at $92.40, with a stop-loss at $92.20 and targets at $94.00 and $95.00.
Spot Gold
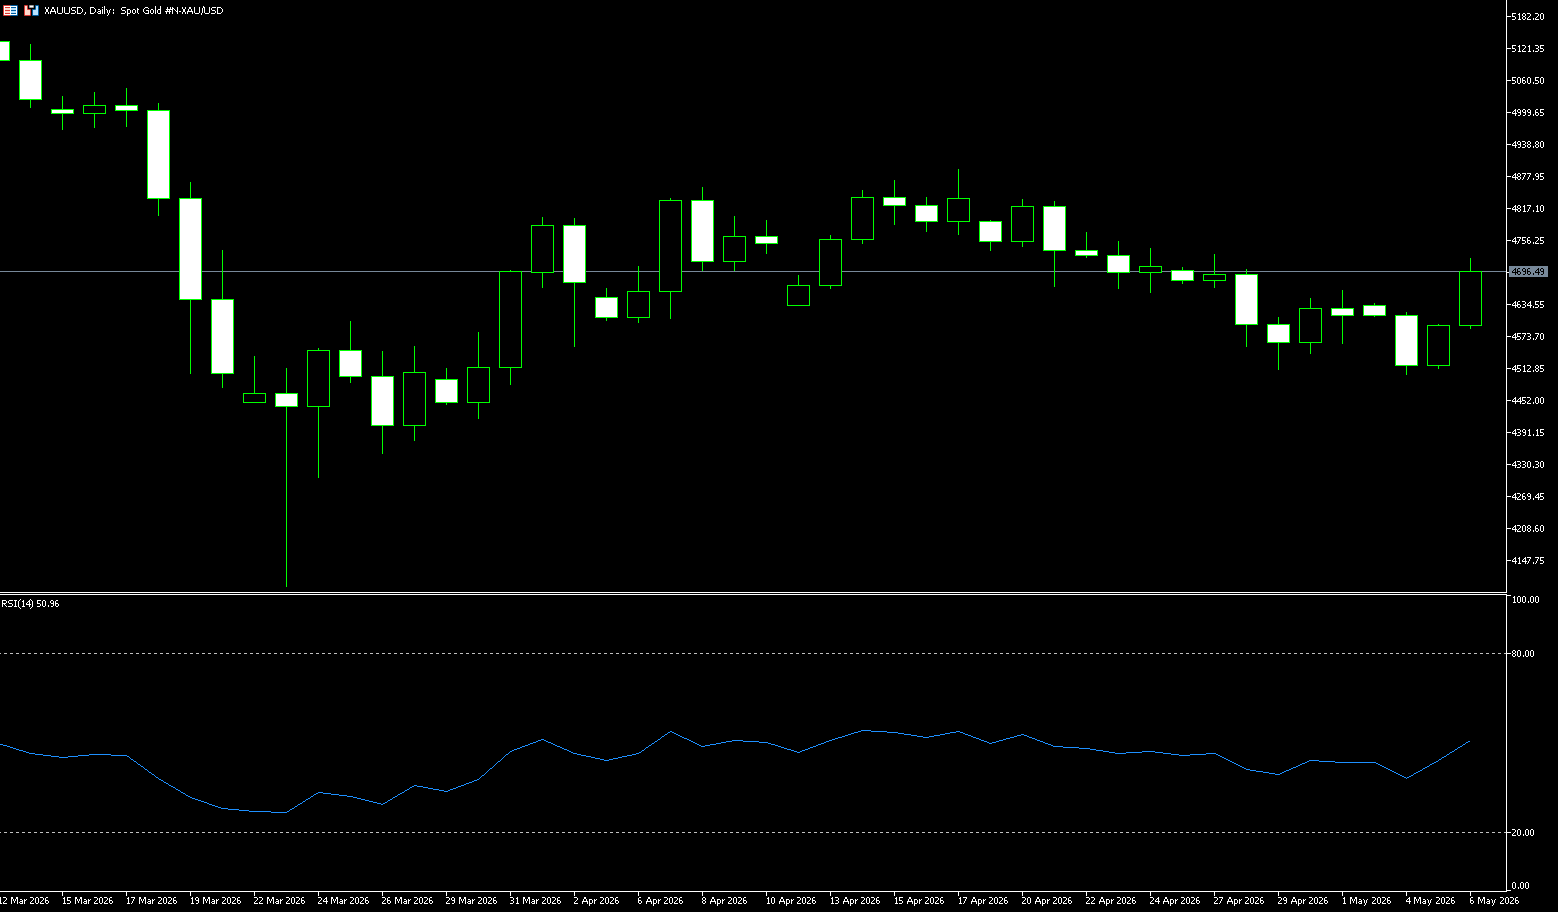
Gold rose to near $4,700 an ounce on Wednesday, marking its second consecutive day of gains, as signs of easing tensions in the Middle East pushed oil prices lower, helping to ease inflation concerns. Defense Secretary Hergace stated that the ceasefire agreement established nearly a month ago remains in effect, while Secretary of State Rubio confirmed that the offensive operations have ended, and Washington is shifting its focus to protecting shipping routes in the Strait of Hormuz. President Trump also announced a temporary suspension of US-led efforts to assist stranded ships in leaving the strait to assess whether an agreement to end the conflict with Iran can be reached, although the blockade of ships traveling to and from Iranian ports will continue. Since the start of the war, gold has faced significant selling pressure. Soaring energy costs have exacerbated inflation concerns and reinforced market expectations that central banks may maintain higher interest rates for an extended period or further tighten policy.
From a technical perspective, the strong rebound from the $4,500 low at the beginning of the week, followed by a break above the $4,600 psychological level, is favorable for gold bulls. The precious metal is gradually approaching the 20-day simple moving average at $4,699.70 and the $4,700 psychological level, which now forms the first resistance zone. A break above this level would lead to further testing of the $4,753 level (the high of April 23). Meanwhile, momentum indicators support an upward stance. In fact, the Relative Strength Index (RSI) is hovering around 50, indicating a firm trend but not yet overbought. Furthermore, the Moving Average Convergence Divergence (MACD) histogram remains positive and rising, suggesting that bullish pressure is being rebuilt as XAU/USD challenges the upper supply zone. On the downside, initial support lies at $4,600 (a psychological level) and the 38.2% Fibonacci retracement level at $4,588.80. If sellers gain momentum, a deeper pullback could find buying interest near the 50.0% Fibonacci retracement level at $4,495.62 and the $4,500 area.
Consider going long on gold today at $4,687, with a stop-loss at $4,680 and targets at $4,750 and $4,770.
AUD/USD
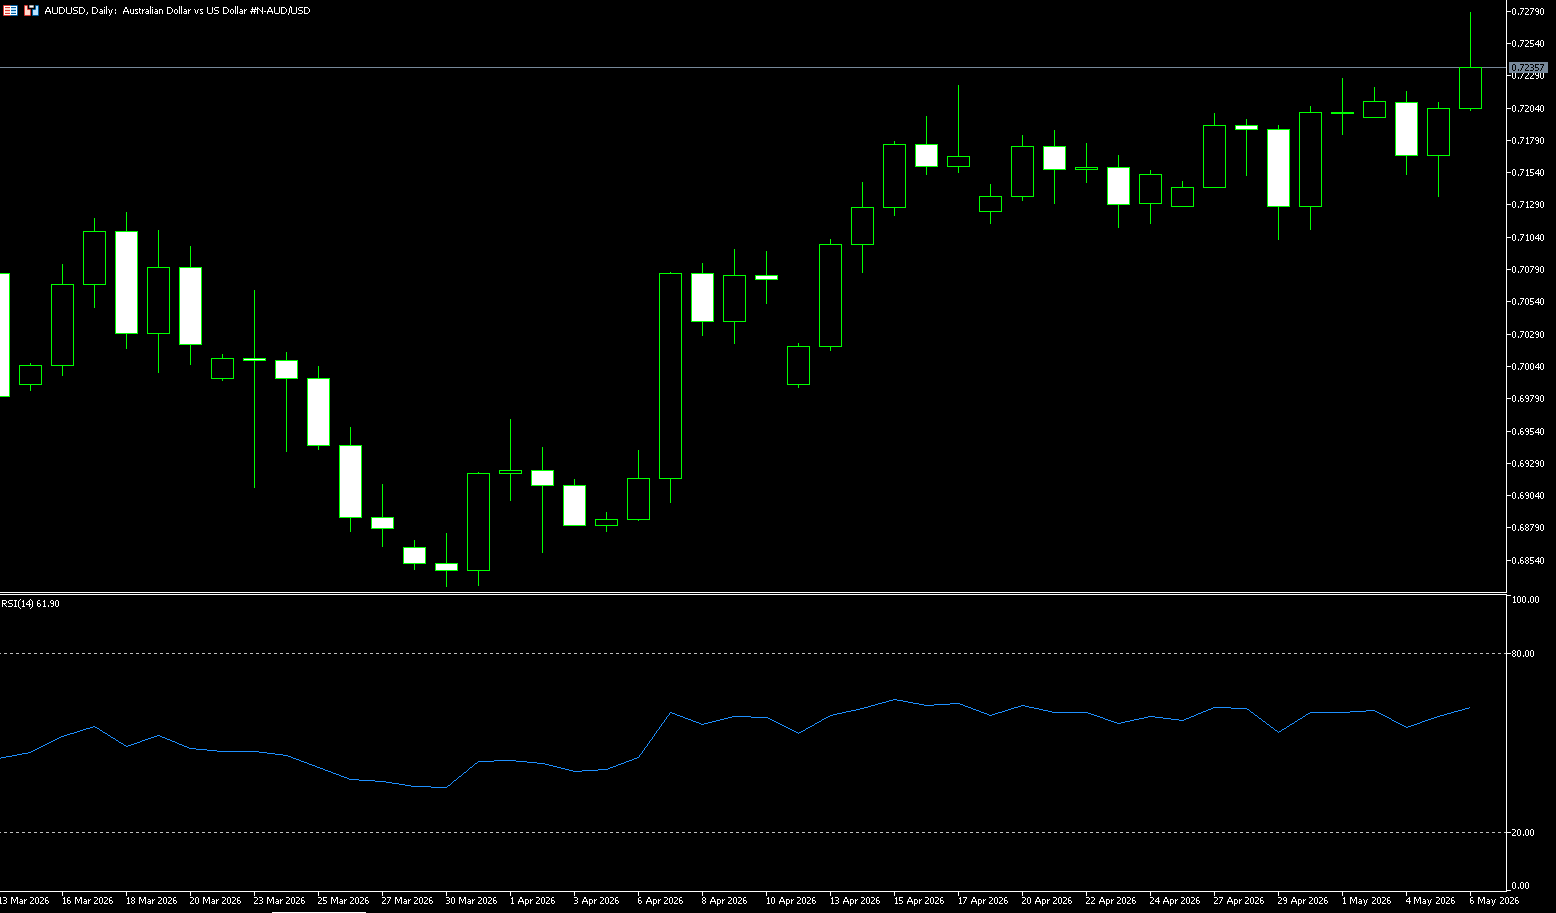
The Australian dollar rose above US$0.7250, reaching a four-year high, after the Reserve Bank of Australia implemented the widely anticipated quarter-point rate hike to 4.35%, while risk appetite improved due to signs of de-escalation in the Middle East conflict. The Australian dollar is often seen as a proxy for global risk, and it rose as global stock markets rebounded following the US announcement of an end to its offensive actions against Iran and a temporary suspension of efforts to assist stranded ships leaving the Strait of Hormuz. Optimistic market sentiment also put pressure on the safe-haven dollar, while the yen surged amid discussions of Japanese intervention. Meanwhile, the Reserve Bank of Australia extended its tightening cycle to a third consecutive meeting, reiterating its commitment to restoring inflation to its 2-3% target. The market now sees only a 20% chance of another rate hike in June, as three rate hikes have given policymakers room to assess the progress of the war with Iran, and the possibility of a further increase to 4.60% by September is already fully priced in.
On the daily chart, the Australian dollar is trading at 0.7230 against the US dollar, continuing its constructive bullish bias, with highs reaching a four-year high of around 0.7278. The pair is holding above its 55-day, 100-day, and 200-day simple moving averages, which are roughly clustered between 0.7066 and 0.6751, reinforcing the underlying uptrend, while the Relative Strength Index (RSI) is near 63, indicating positive momentum but not overextended. Initial support is located around the 0.7172 (14-day simple moving average) area, with further support at 0.7100 (psychological level) on a deeper pullback. Immediate resistance is at 0.7270 (June 2, 2022 high) and the 0.7300 (psychological level).
Consider going long on the Australian dollar today at 0.7225, with a stop loss at 0.7215 and targets at 0.7270 and 0.7280.
GBP/USD
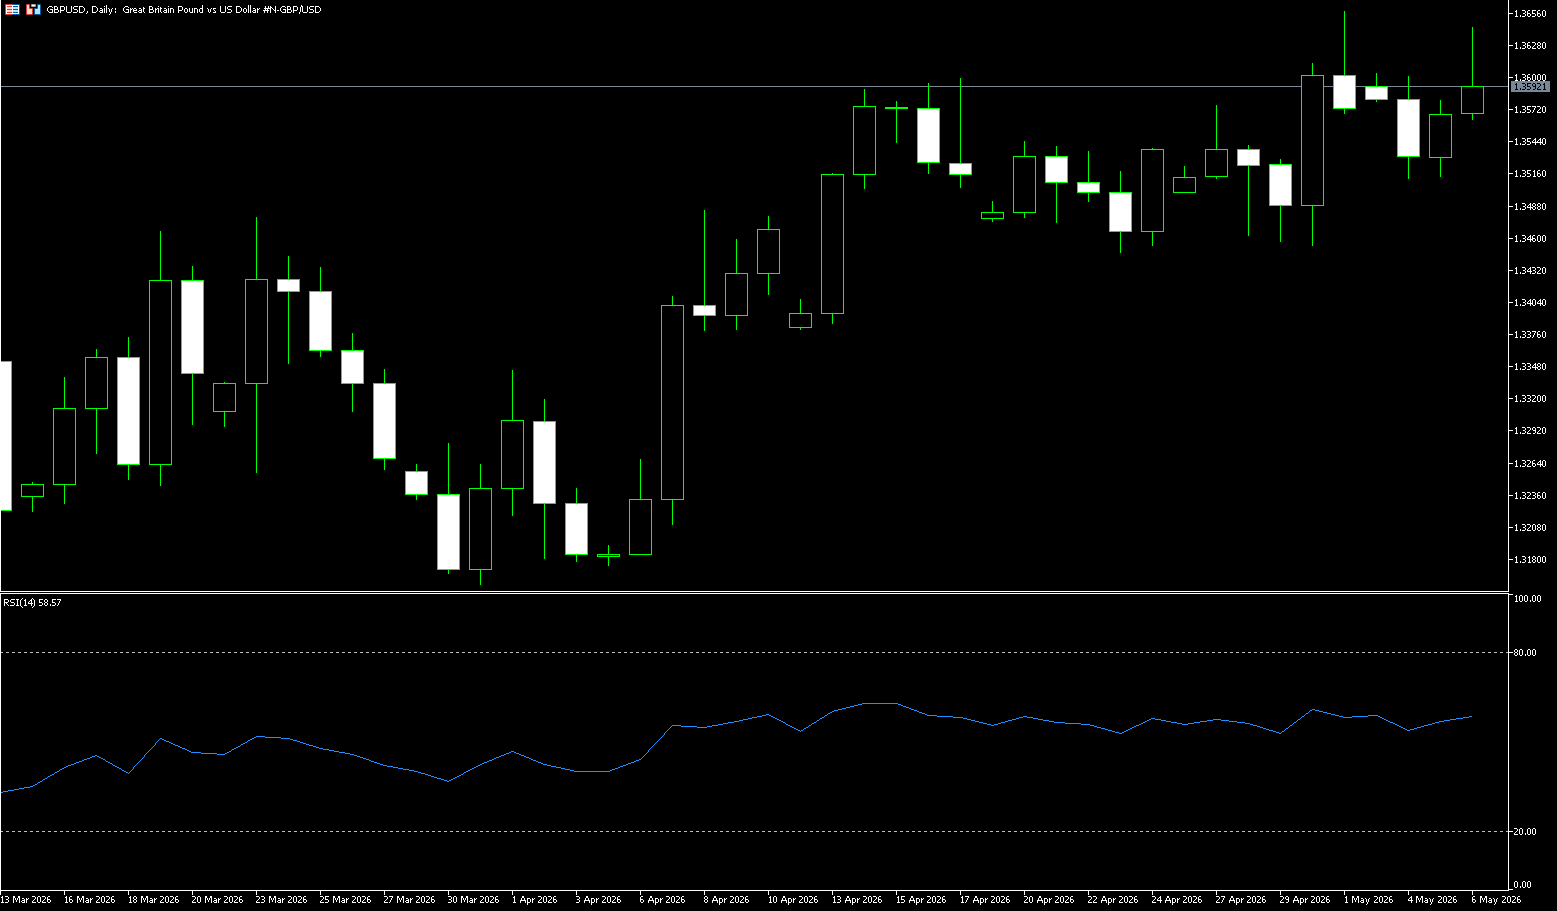
The pound accelerated its rebound against the dollar on Wednesday, reaching a session high of 1.3645 so far, after rebounding from a weekly low near 1.3500 on Tuesday. Growing hopes that the Middle East war may be nearing its end weighed on the safe-haven dollar and provided support for the pound. US President Trump boosted market sentiment earlier on Wednesday by announcing a suspension of the "Freedom Program," which aims to escort ships through the Strait of Hormuz, and claiming "significant progress" in peace talks with Tehran. Investors paid attention to these comments, reducing their safe-haven dollar positions and boosting risk-averse currencies such as the pound. Currently, the Strait of Hormuz remains closed with no plans to reopen, and attacks on Gulf states are temporarily ignored. On the economic calendar, in the US, if Wednesday's ADP April employment data shows faster growth, this will set an optimistic tone for Friday's non-farm payroll report, which will be analyzed from a monetary policy perspective, following a hawkish shift in the latest Fed meeting.
On the daily chart, a mild bullish bias is maintained as it holds steady above the 20-day simple moving average (1.3526) and a slightly bullish short-term bias is maintained as spot prices hold above the 50-day (1.3415) and 100-day (1.3476) simple moving averages. The pair consolidated in the upper half of its recent trading range, with a relative strength index (14) of 61.20, suggesting that the rally was robust but not excessive as prices approached the upper boundary. On the upside, short-term resistance lies near last week's high of 1.3658. A clear break above this level would open up further upside potential to the 1.3700 psychological level. Initial support is located around 1.3538 (Wednesday's low) and the 20-day simple moving average (1.3526); followed by the 1.3500 level.
Consider going long on GBP at 1.3580 today, with a stop-loss at 1.3570 and targets at 1.3640 and 1.3650.
USD/JPY
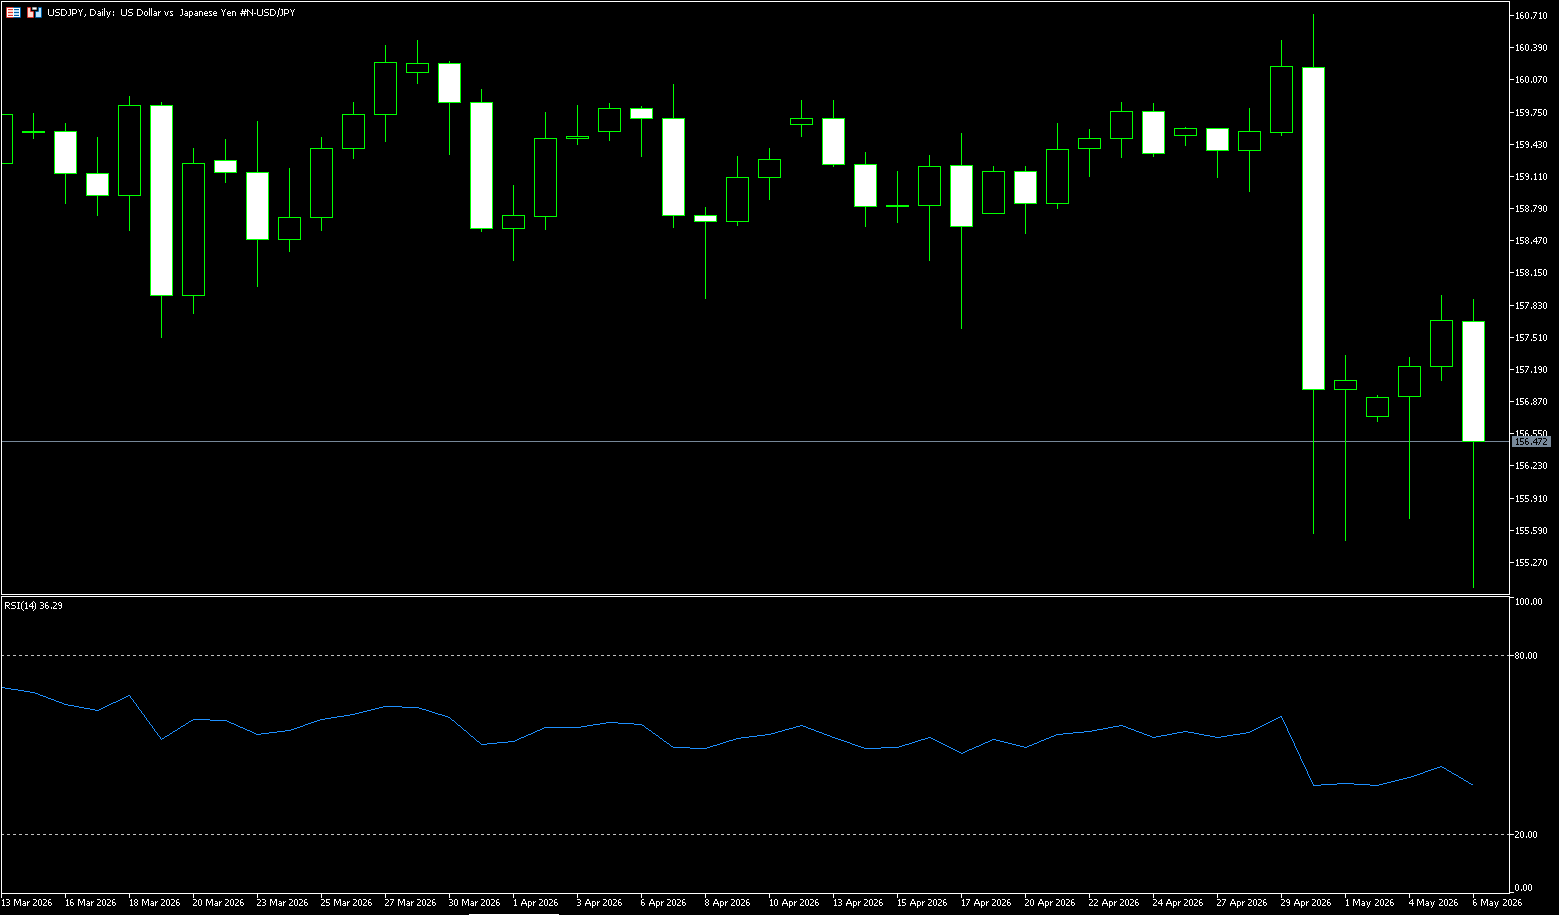
The yen rose to 155.05 yen per dollar on Wednesday, ending a three-day losing streak, as the dollar and oil prices declined on signs of easing tensions in the Middle East. Washington reiterated the ceasefire, confirmed the end of attacks on Iran, and temporarily suspended efforts to assist ships stranded in the Strait of Hormuz to allow time for possible renegotiations with Tehran. Given Japan's heavy reliance on oil imports from the Gulf, the yen is particularly sensitive to developments in the Middle East. Meanwhile, investors remained wary of the possibility of official support for the currency, given the Japanese authorities' intervention last week. It is estimated that Tokyo may have injected around $35 billion to stabilize the yen, although officials have not confirmed any intervention. However, the yen's recent pullback suggests a lack of further follow-up action from policymakers.
The dollar rebounded from a ten-week low against the yen, but was pressured near 155.05 in early Asian trading on Wednesday. Market speculation of renewed foreign exchange intervention by Japanese authorities fueled the latest wave of yen strength, keeping bearish pressure on the pair intact. On the daily chart, the dollar/yen pair is trading at 156.25. The pair maintains a short-term bearish bias as prices remain below the 5-day simple moving average at 157.02 and the psychological level of 157, keeping the broader downtrend intact. The stochastic oscillator has fallen back to 37, indicating that downward momentum is resuming after a period of consolidation within a sustained bearish structure. Initial support is seen around Wednesday's low of 155.05. A drop to this level would maintain a broader bullish bias as long as the pair trades above the 200-day simple moving average at 154.02. A daily close above the 5-day simple moving average at 157.02 and the psychological level of 157 would open the way for a retest of 157.94 (Wednesday's high) and the 158 level.
Consider shorting the US dollar today at 156.55, with a stop loss at 156.75 and targets at 155.80 and 155.60.
EUR/USD
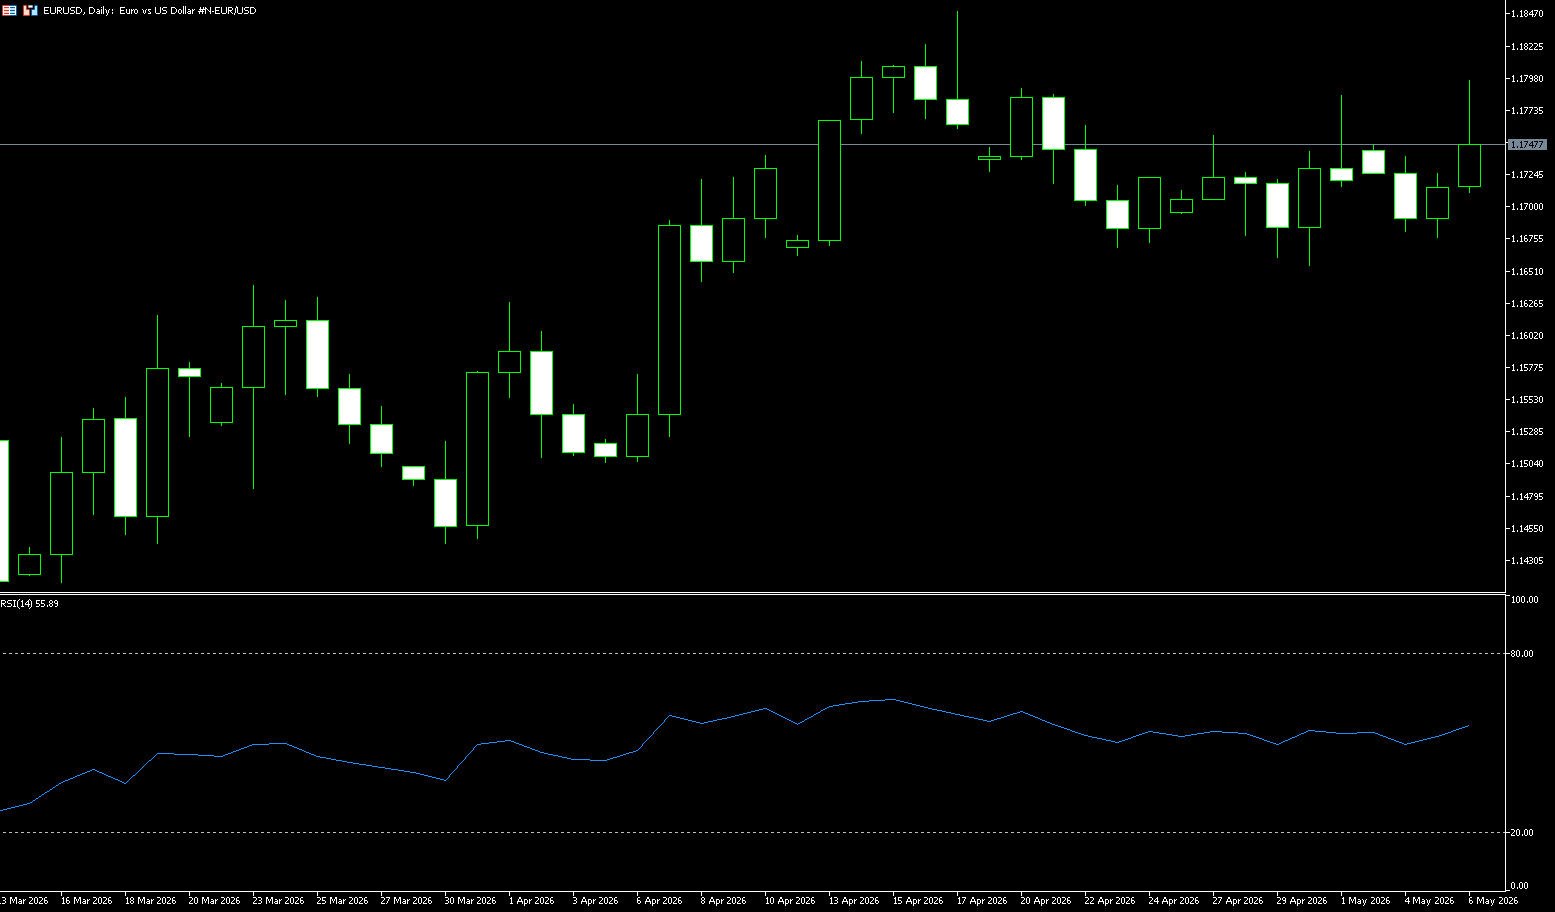
EUR/USD held steady above 1.1750 during Wednesday's European session, trading at its highest level since April 21, supported by improved risk sentiment, which diminished the safe-haven appeal of the US dollar. US President Trump's statement that the "Freedom Project" and ship movement through the Strait of Hormuz had been suspended boosted risk trading. However, he emphasized that the US blockade of ships traveling to and from Iranian ports will "remain fully effective," leaving uncertainty about the future of the Straits. The currency market now expects the ECB's deposit facility rate to reach around 2.7% in December, reflecting two fully priced-in rate hikes and a possible third, with an 85% probability of a first hike in June. The euro/dollar ended a three-day losing streak and is above the 1.1700 level amid a stronger dollar due to uncertainty in the Middle East. A plethora of conflicting news headlines this week have left market participants confused. Optimism about a deal between the US and Iran has faded as anticipated negotiations in Islamabad failed to materialize.
The euro/dollar is trading steadily around 1.1740, maintaining a slight bullish bias, as it is above the 25-day simple moving average at 1.1701 and between key Fibonacci retracement levels of the latest wave. The currency pair is hovering slightly below the 50.0% Fibonacci retracement level at 1.1745, indicating that upward momentum has slowed but not yet reversed, while the Relative Strength Index (RSI) is around 58, suggesting constructive but not overextended upward momentum. On the upside, short-term resistance is at 1.1785 (last week's high), followed by the 61.8% level at 1.1825, with further resistance at the April high of 1.1850. Initial support on the downside is provided by the 25-day simple moving average at 1.1701, followed by the 38.2% Fibonacci level at 1.1666; and 1.1679 (the 200-day simple moving average); a deeper pullback would expose 1.1600 as a more distant structural support bottom.
Consider going long on the Euro today at 1.1740, with a stop-loss at 1.1730 and targets at 1.1780 and 1.1790.
Disclaimer: The information contained herein (1) is proprietary to BCR and/or its content providers; (2) may not be copied or distributed; (3) is not warranted to be accurate, complete or timely; and, (4) does not constitute advice or a recommendation by BCR or its content providers in respect of the investment in financial instruments. Neither BCR or its content providers are responsible for any damages or losses arising from any use of this information. Past performance is no guarantee of future results.
Lebih Liputan


Pendedahan Risiko:Instrumen derivatif diniagakan di luar bursa dengan margin, yang bermakna ia membawa tahap risiko yang tinggi dan terdapat kemungkinan anda boleh kehilangan seluruh pelaburan anda. Produk-produk ini tidak sesuai untuk semua pelabur. Pastikan anda memahami sepenuhnya risiko dan pertimbangkan dengan teliti keadaan kewangan dan pengalaman dagangan anda sebelum berdagang. Cari nasihat kewangan bebas jika perlu sebelum membuka akaun dengan BCR.
BCR Co Pty Ltd (No. Syarikat 1975046) ialah syarikat yang diperbadankan di bawah undang-undang British Virgin Islands, dengan pejabat berdaftar di Trident Chambers, Wickham’s Cay 1, Road Town, Tortola, British Virgin Islands, dan dilesenkan serta dikawal selia oleh Suruhanjaya Perkhidmatan Kewangan British Virgin Islands di bawah Lesen No. SIBA/L/19/1122.
Open Bridge Limited (No. Syarikat 16701394) ialah syarikat yang diperbadankan di bawah Akta Syarikat 2006 dan berdaftar di England dan Wales, dengan alamat berdaftar di Kemp House, 160 City Road, London, City Road, London, England, EC1V 2NX. Entiti ini bertindak semata-mata sebagai pemproses pembayaran dan tidak menyediakan sebarang perkhidmatan perdagangan atau pelaburan.

 English
 简体中文
简体中文
 繁體中文
繁體中文
 Bahasa
Melayu
Bahasa
Melayu
 Tiếng
Việt
Tiếng
Việt
 ไทย
ไทย
 日本語
日本語
 한국어
한국어
 ភាសាខ្មែរ
 español