

0
US Dollar Index
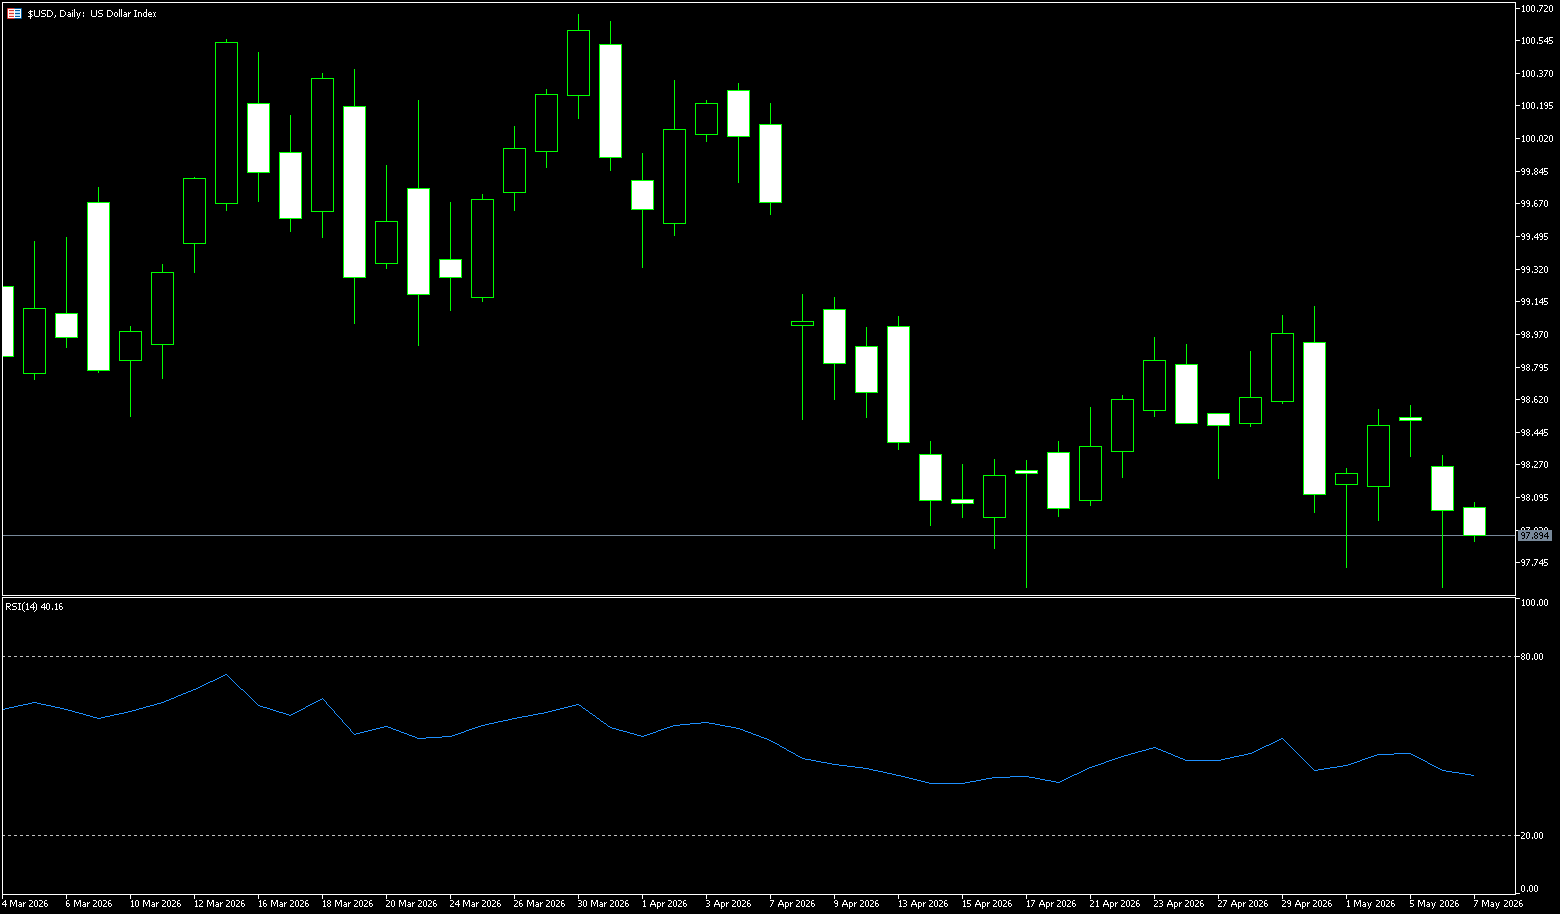
The US dollar index briefly fell below 98 on Thursday, extending its decline from the previous trading day, as market expectations rose for a US-Iran agreement to end the war. Reports indicated that the two sides were close to reaching a one-page, 14-point memorandum of understanding aimed at formally ending the conflict, potentially reopening the Strait of Hormuz, and laying the groundwork for more detailed nuclear negotiations. However, President Trump warned that no final agreement had been reached and cautioned that military strikes could resume if Tehran failed to comply. Easing geopolitical risks led to a sharp drop in oil prices, helping to alleviate inflation concerns and reducing market expectations that central banks would need to maintain restrictive policies for an extended period. Nevertheless, Chicago Federal Reserve President Goolsby spoke cautiously, noting that inflation had not continued to decline toward the Federal Reserve's 2% target and had actually risen since the start of the conflict.
From a technical perspective, the US dollar index is currently trading slightly above 98 on the daily chart, having broken below the key support levels of the 200-day simple moving average at 98.54 and the psychological level of 98.00, forming a typical bearish engulfing pattern. The dollar index continues its downtrend since April, exhibiting a consistent pattern of lower highs and lower lows, with a complete downward channel. The RSI indicator is currently below 41, clearly showing bearish momentum and approaching oversold territory, indicating that the downward momentum has been released. Fibonacci retracement levels point to the next key support zone of 97.50 to 96.65. A break below Wednesday's low of 97.62 could lead to a move towards the 97.00-96.65 range. On the upside, the 200-day simple moving average at 98.54 and 98.70 (the low of April 27th) have turned from support into resistance. As long as the price remains below 99, the overall bearish structure is unlikely to change, and any technical rebound will face resistance from the upper channel line.
Today, consider shorting the US Dollar Index at 98.36, with a stop-loss at 98.46 and targets at 97.70 and 97.80.
WTI Crude Oil
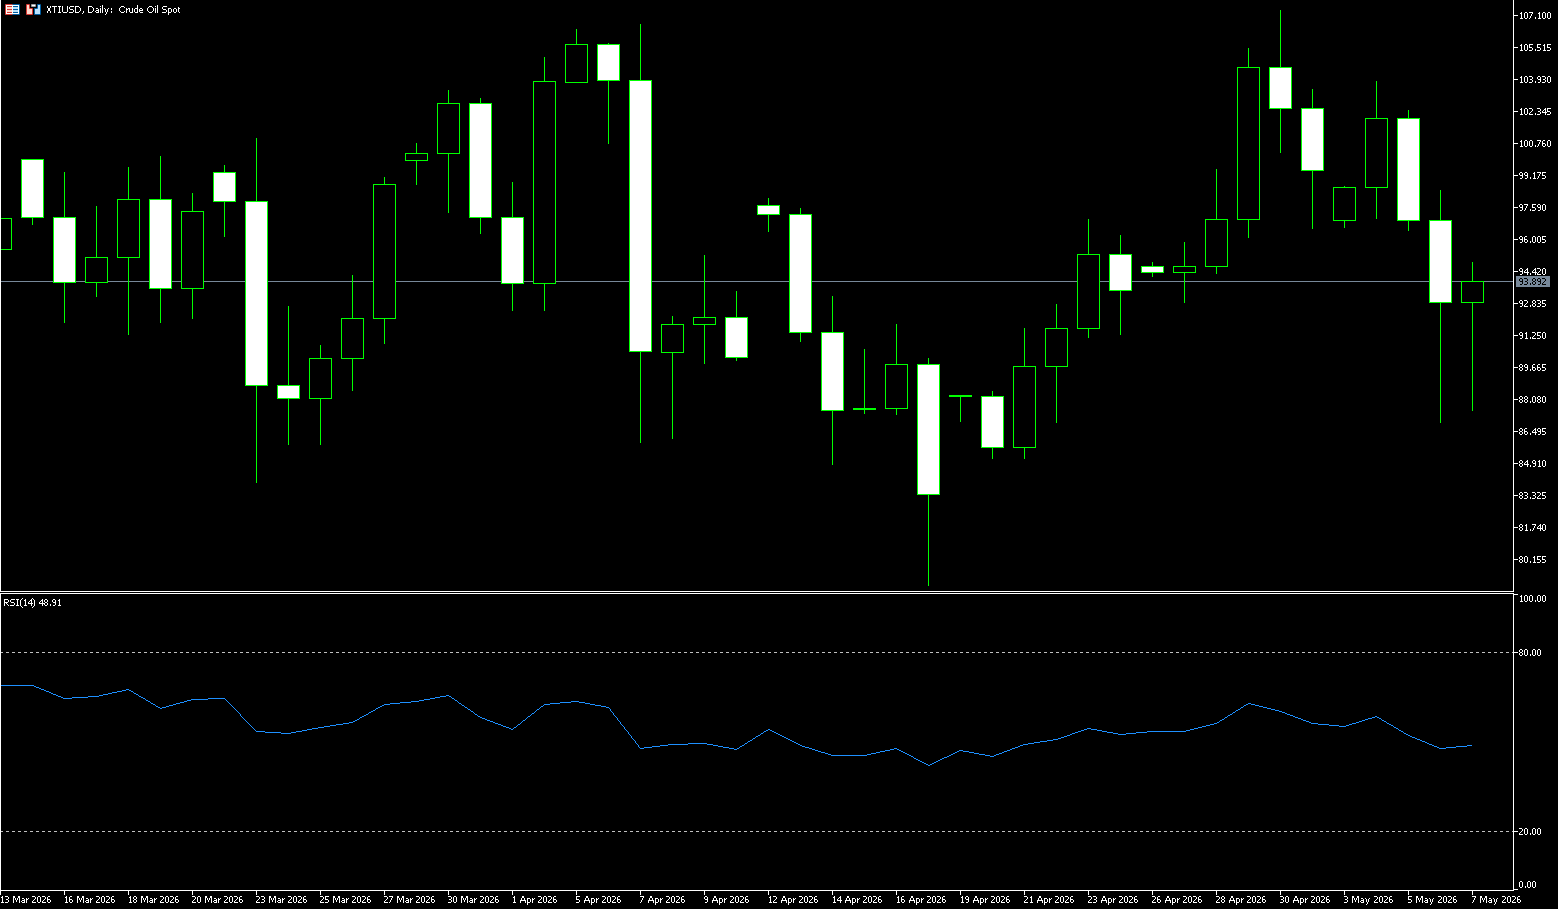
WTI crude oil fell to near $90 a barrel on Thursday, after plunging more than 10% to $86.90 in the previous session, as investors weighed the prospects for a Middle East peace agreement. Reports indicate that the US sent a one-page memorandum of understanding through Pakistani intermediaries, aimed at formally ending the conflict and paving the way for the gradual reopening of the Strait of Hormuz. Tehran is expected to respond within days after confirming it is reviewing the US proposal, although broader negotiations surrounding Iran's nuclear program are reportedly scheduled for later. However, President Trump warned that an agreement is not yet finalized, considering Iran's acceptance of the proposal a "major assumption," while threatening to resume military strikes if Iran does not comply. Meanwhile, the latest data shows that US oil exports climbed to a record high last week due to conflict-related shortages, with countries increasingly turning to US supplies.
The core driving logic of the current international crude oil market has gradually shifted from simple geopolitical speculation to a balance between "supply recovery expectations" and "the reality of low global inventories." In the short term, if the US-Iran negotiations continue to make progress, it will alleviate market concerns about shipping risks in the Strait of Hormuz, and international oil prices may continue to correct from their highs. From a technical perspective, WTI crude oil maintains a medium-term upward structure on the daily chart. After breaking through the psychological level of $100, oil prices rose rapidly and are currently in a short-term consolidation phase at high levels. The area around $90 has become a key watershed between bullish and bearish sentiment in the short term. If the $90 support is breached, oil prices may further correct to the $86.96 (60-day simple moving average) and $86.92 (Wednesday's low) area; then the $80.00 (psychological level). On the upside, the resistance areas to watch are $94.82 (25-day simple moving average) and $99.71 (Wednesday's high).
Today, consider going long on crude oil at 89.45, with a stop loss at 89.30 and targets of 91.00 and 92.00.
Spot Gold
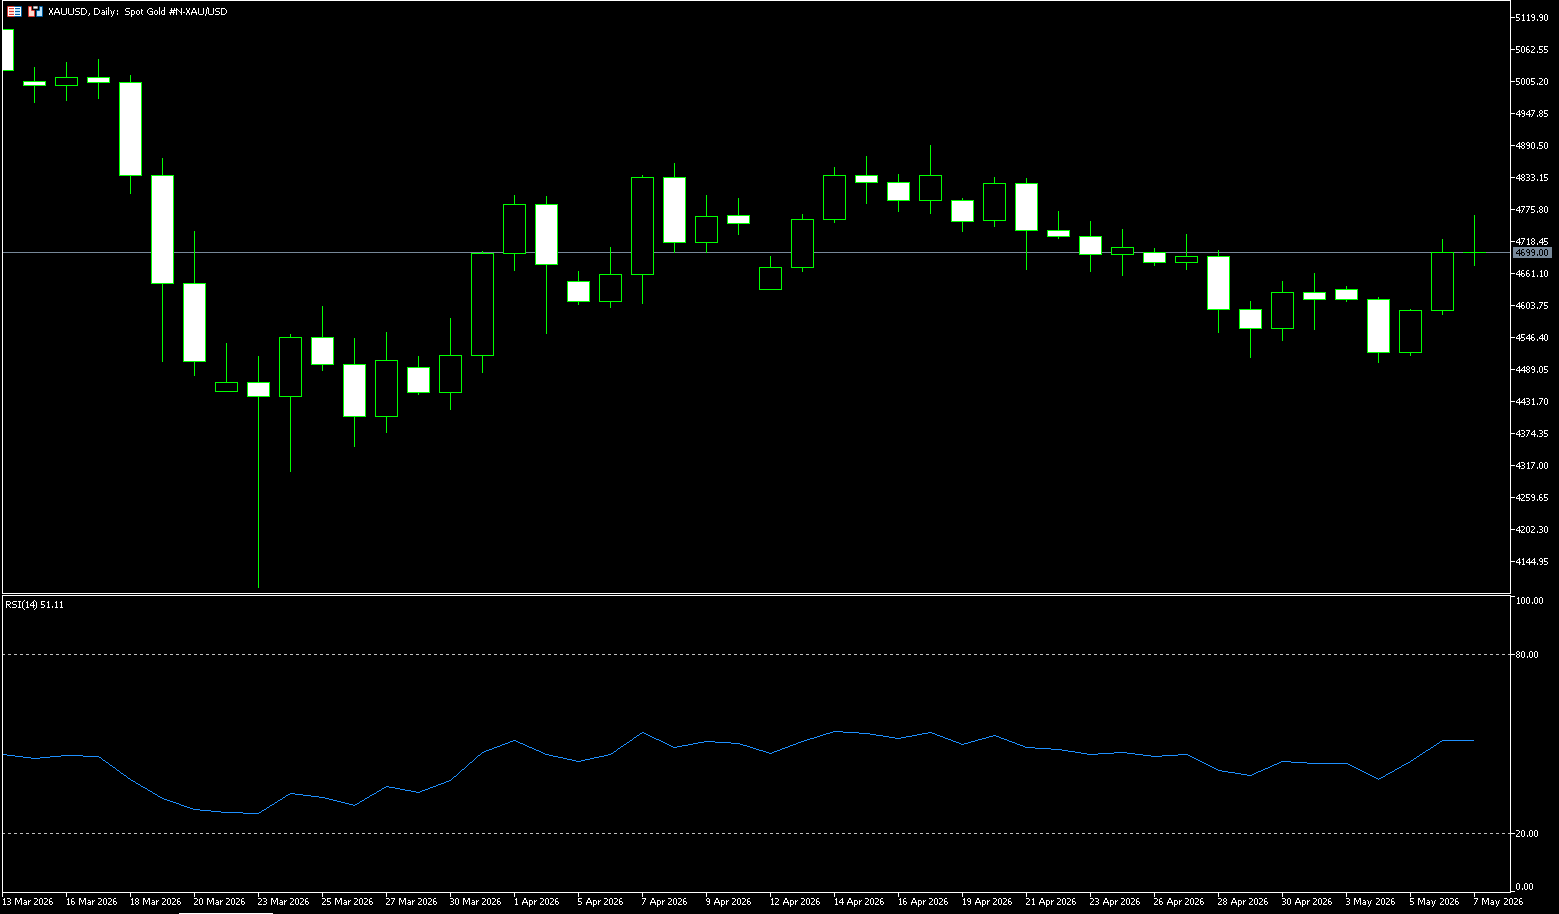
On Thursday, gold prices rose to around $4,700 per ounce, after gaining about 3% in the previous trading session. Hopes for a US-Iran deal triggered a sharp drop in oil prices, helping to ease inflation concerns. Reports indicated that the US sent a one-page memorandum of understanding through Pakistani mediators aimed at formally ending the conflict and potentially allowing for a gradual reopening of the Strait of Hormuz. Tehran is expected to respond in the coming days, confirming that it is reviewing the US peace proposal, while more comprehensive negotiations on Iran's nuclear program are expected later. The plunge in oil prices eased concerns about inflationary pressures and reduced market expectations that central banks would need to maintain restrictive policies for a longer period. Nevertheless, Chicago Federal Reserve President Austan Goolsby warned that inflation has not continued to cool toward the US central bank's 2% target, but has instead accelerated since the outbreak of the war.
In summary, the core driver of this round of gold price increases is the "triple positive" effect triggered by the expectation of a US-Iran peace agreement: the plunge in oil prices alleviates inflationary pressures, a weaker dollar increases the attractiveness of gold, and declining bond yields lower holding costs. In the short term, as long as the positive atmosphere of peace negotiations is maintained, gold is expected to continue to receive support. From a technical perspective, gold maintains a strong upward structure on the daily chart. After the price stabilized above $4,600, bullish momentum has clearly recovered. Currently, the area around $4,753 (the high on April 23) has become a key short-term resistance zone. If it breaks through effectively, the market may further test the $4,800 (psychological level) to the $4,850 range. On the downside, the $4,625 (10-day moving average) and $4,600 (psychological level) have formed important short-term support levels. If the price retraces but holds this area, the overall upward trend will remain intact. The daily MACD indicator has formed a golden cross again, and the RSI indicator has risen back into the strong zone, indicating that the medium-term bullish trend still dominates.
Today, consider going long on gold at 4,687, with a stop-loss at 4,682 and targets at 4,750 and 4,760.
AUD/USD
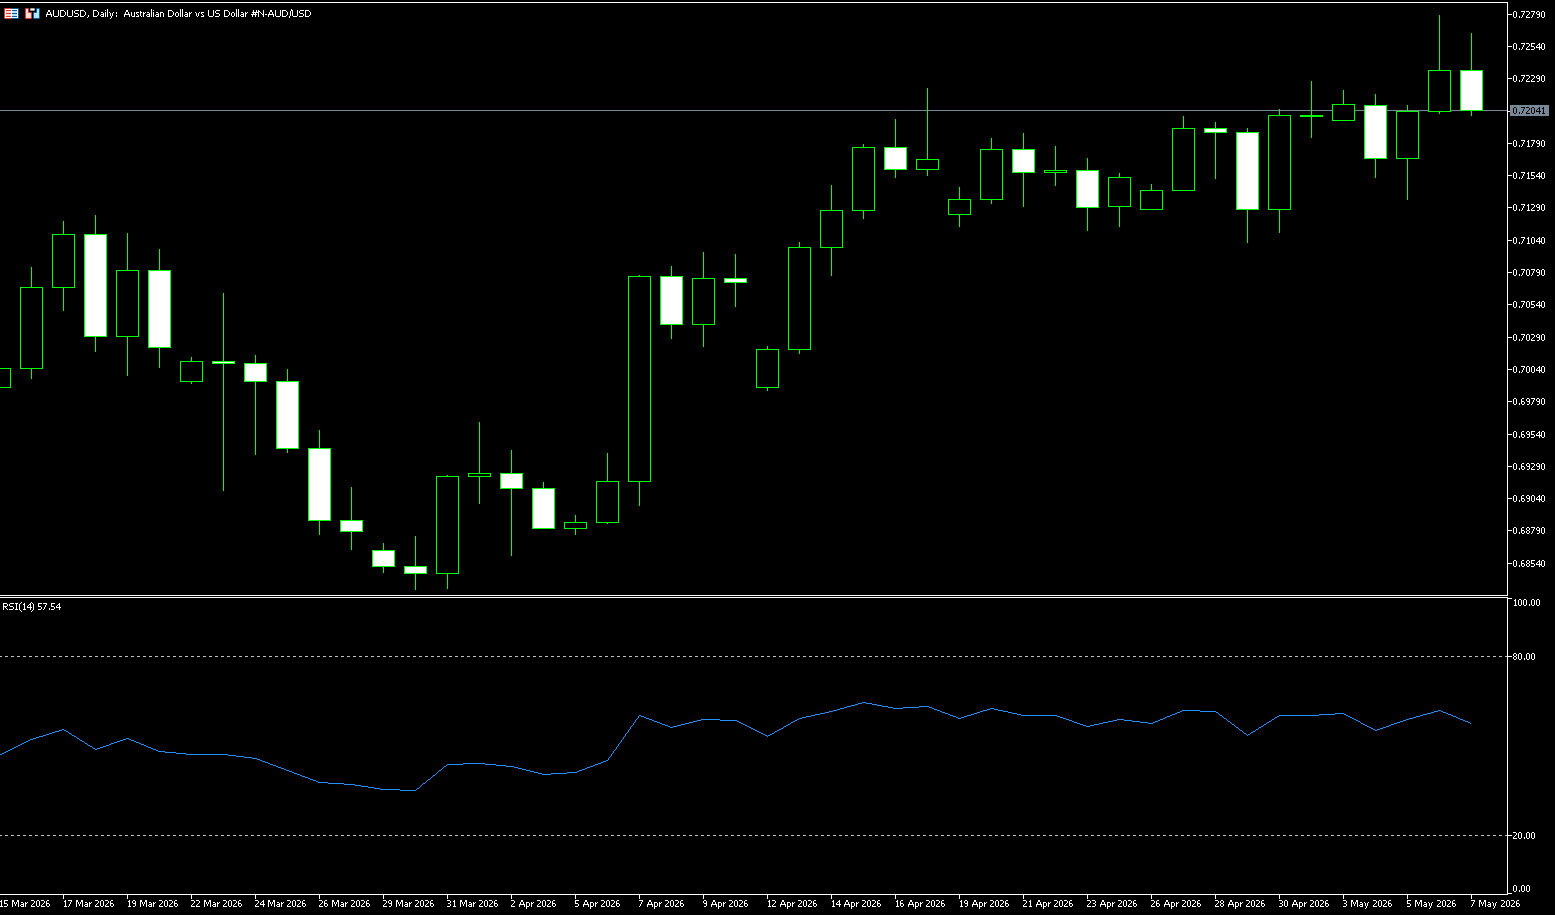
The Australian dollar rose above US$0.7250, reaching a four-year high, as increased expectations for a Middle East peace agreement weakened the safe-haven US dollar, while disappointing domestic trade data weighed on market sentiment. Australia unexpectedly recorded a A$1.84 billion goods trade deficit in March, its first in eight years, driven by a surge in imports of data center computing equipment and a significant increase in fuel shipments due to price increases caused by the conflict with Iran. Elsewhere, the US dollar continued to be pressured following news that the US and Iran are moving towards a formal end to the conflict, which could reopen the Strait of Hormuz and pave the way for further nuclear negotiations. The Australian dollar also continued to benefit from the Reserve Bank of Australia's rate hike this week. The market now sees only a 20% chance of another rate hike in June after three hikes this year, while the probability of a further increase to 4.60% by September is fully priced in.
The overall backdrop for the Australian dollar remains supportive of its trend, and the Reserve Bank of Australia's stance should continue to provide some support during pullbacks. However, it remains a currency highly dependent on sentiment-driven trading. The Australian dollar performs well when confidence is strong; the US dollar tends to prevail when uncertainty increases. On the daily chart, the Australian dollar reached a high of 0.7250 against the US dollar, maintaining a constructive bullish bias as it remains above the 20-day simple moving average at 0.7163 and is now supporting the upside. The Relative Strength Index (RSI) is near 63, indicating strong but not yet overheated upward momentum, potentially leading to a consolidation phase. On the upside, initial resistance lies at the recent horizontal resistance level of 0.7270 (the high of June 2, 2022), a break above which would open the door to the next resistance level at 0.7300 (the psychological level). Immediate support is seen around the 0.7163 (20-day simple moving average) area, with further support at the 0.7100 (psychological level) on a deeper pullback. Buyers are expected to hold the broader bullish structure here.
Consider going long on the Australian dollar at 0.7195 today, with a stop loss at 0.7185 and targets at 0.7240 and 0.7250.
GBP/USD
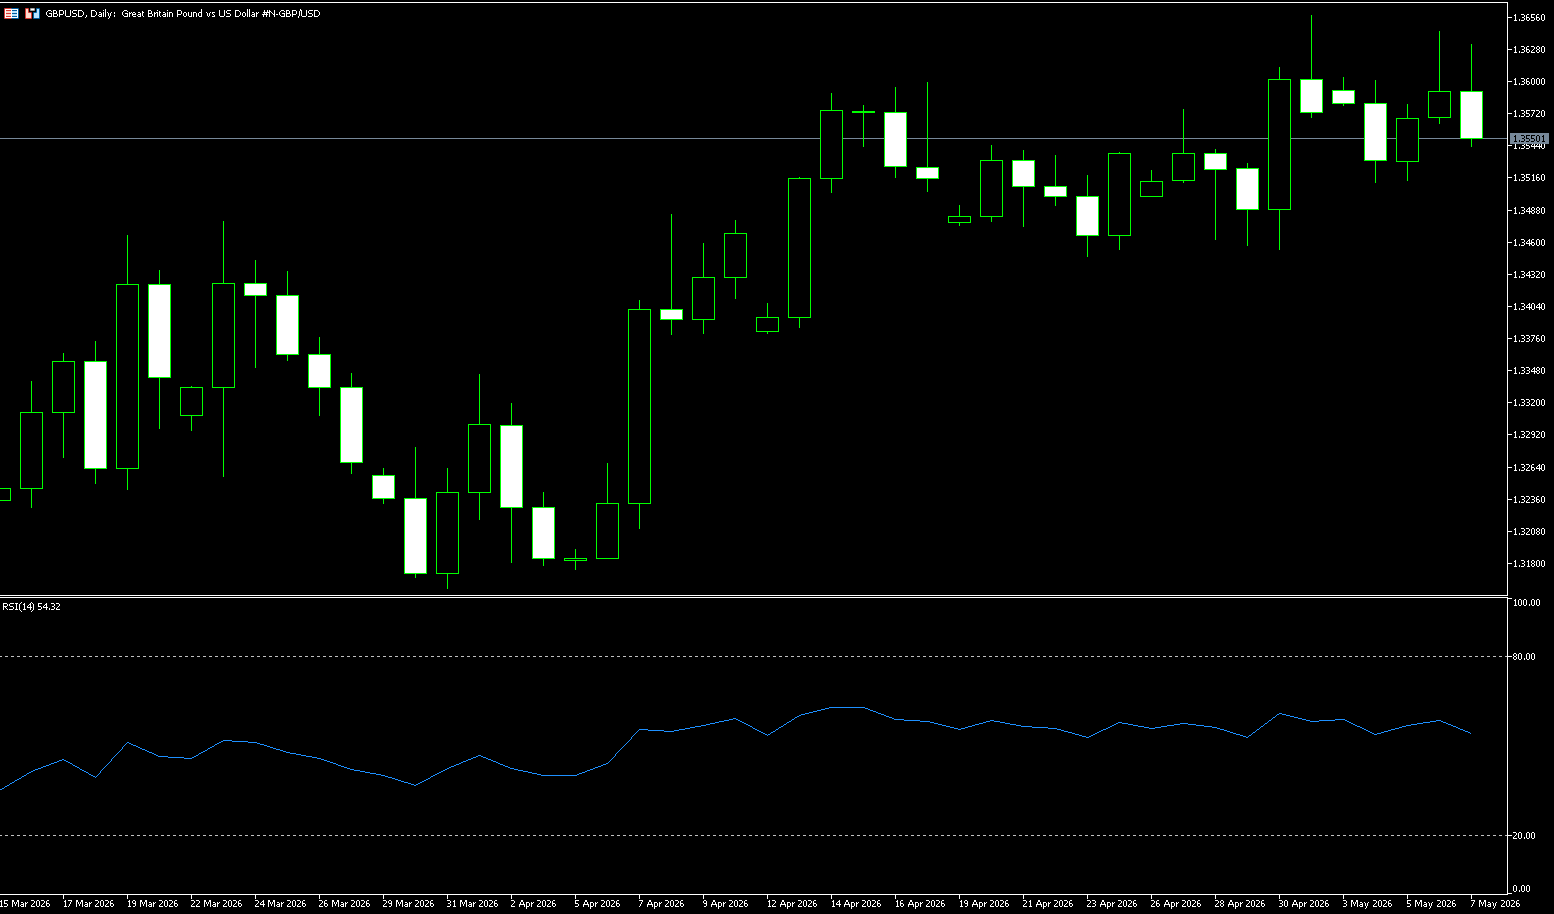
During Thursday's European trading session, the pound was relatively stable against major currencies, trading sideways around 1.3550 against the dollar. The pound fluctuated as investors awaited Iran's response to the US one-page proposal, which limits Tehran's nuclear ambitions, calls for the reopening of the Strait of Hormuz, and sets a 30-day ceasefire window. Iran stated it is reviewing the US one-page memorandum of understanding, while Pakistan, acting as a mediator between the US and Iran, indicated that the two countries are close to reaching a one-page memorandum to end the war. Looking ahead, the main driver for the pound against the dollar will be the US April non-farm payroll data released on Friday. This labor market report is expected to show a decrease in new jobs, a stable unemployment rate, and accelerating wage growth. Domestically, the pound will be influenced by market expectations regarding the Bank of England's monetary policy outlook. The Bank of England is expected to keep interest rates unchanged until 2026, but could raise them by 50 to 75 basis points if the US-Iran conflict continues.
The current movement of the pound against the dollar is driven by multiple positive factors, including a weaker dollar, improved risk sentiment, and policy support from the Bank of England. Policy divergence and macroeconomic data will be key to determining the subsequent trend. Overall, the short-term trend is bullish, but volatility is expected to increase. From a technical perspective, the daily chart of the pound against the dollar shows a fluctuating upward trend. The exchange rate has rebounded from its lows and regained its position above 1.3550, indicating a recovery in short-term bullish momentum. The current resistance level to watch is last week's high of 1.3658. A clear break above this level would open up further upside potential to the 1.3700 psychological level. Support levels are initially at around 1.3538 (Wednesday's low) and the 20-day simple moving average (1.3533); followed by the 1.3500 level. The RSI indicator has rebounded into the neutral-to-strong zone, and the MACD is gradually forming a golden cross, indicating that upward momentum is strengthening.
Consider going long on GBP/USD today at 1.3540, with a stop-loss at 1.3530 and targets at 1.3600 and 1.3610.
USD/JPY
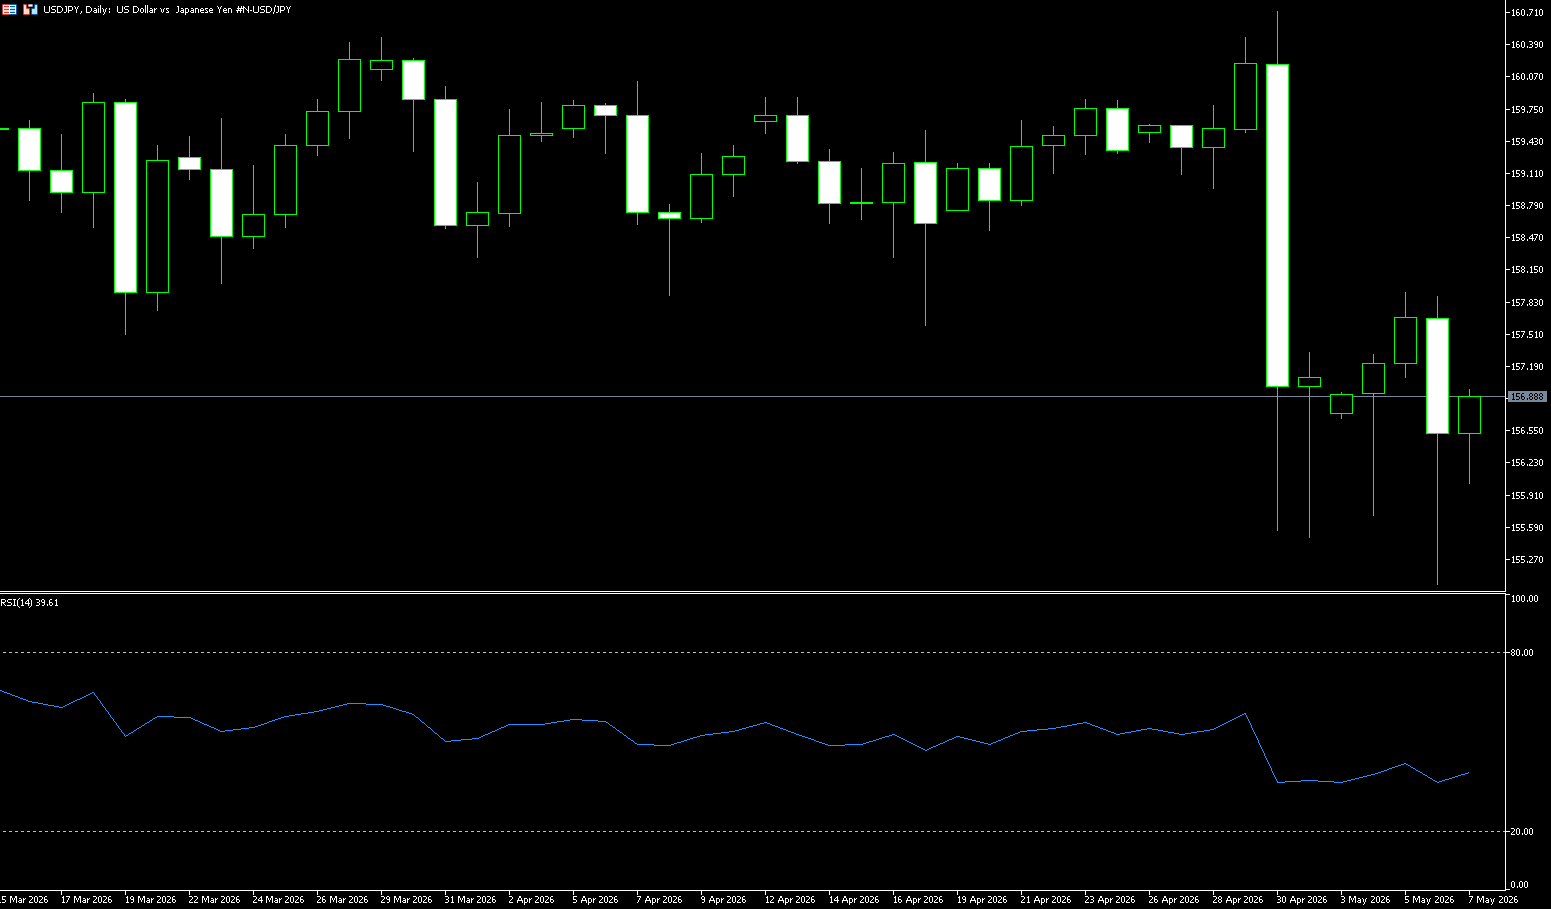
The yen traded around 156.60 yen per dollar on Thursday, rising about 1% overnight, widely attributed to intervention in Tokyo. The Treasury has not confirmed any official action in the foreign exchange market, although Finance Minister Satsushige Katayama recently warned of “decisive measures” against speculative trading, maintaining high vigilance during the Golden Week holiday. The yen had risen as much as 3% before the April 30 holiday but retreated due to a lack of sustained policy follow-through. Externally, the yen was also supported by a weaker dollar, as expectations of an end-of-war agreement between the US and Iran reduced safe-haven demand for the dollar. Meanwhile, the sharp drop in oil prices helped ease inflation concerns, reducing market expectations that the Federal Reserve would need to adopt a stricter interest rate stance.
Overall, Japanese authorities appear to have intervened again, successfully pushing USD/JPY down from the key resistance level of 160. Historical experience suggests that such interventions often foreshadow a medium-term top, but the depth of the pullback will depend on the subsequent strength of the US dollar, the trend of US Treasury yields, and further actions by Japanese authorities. The daily chart shows USD/JPY potentially forming a bearish outside pattern, but it has currently found support at the 200-day simple moving average (SMA) at 154.27. Considering the pair has recovered more than a third of the losses caused by the suspected intervention, there may be room for a slight rebound. However, given that authorities are not keen on a strong yen, once the dust settles, USD/JPY shorts may seek to re-enter the market. The 156.99 (5-day SMA) and 157.50 levels are potential areas for short sellers to consider selling on rallies, anticipating a drop to 155.05 (this week's low), which would be beneficial for a retest of the trend support near 154.27 (200-day SMA).
Today, consider shorting the US dollar at 157.05, with a stop loss at 157.15 and targets at 156.30 and 156.20.
EUR/USD
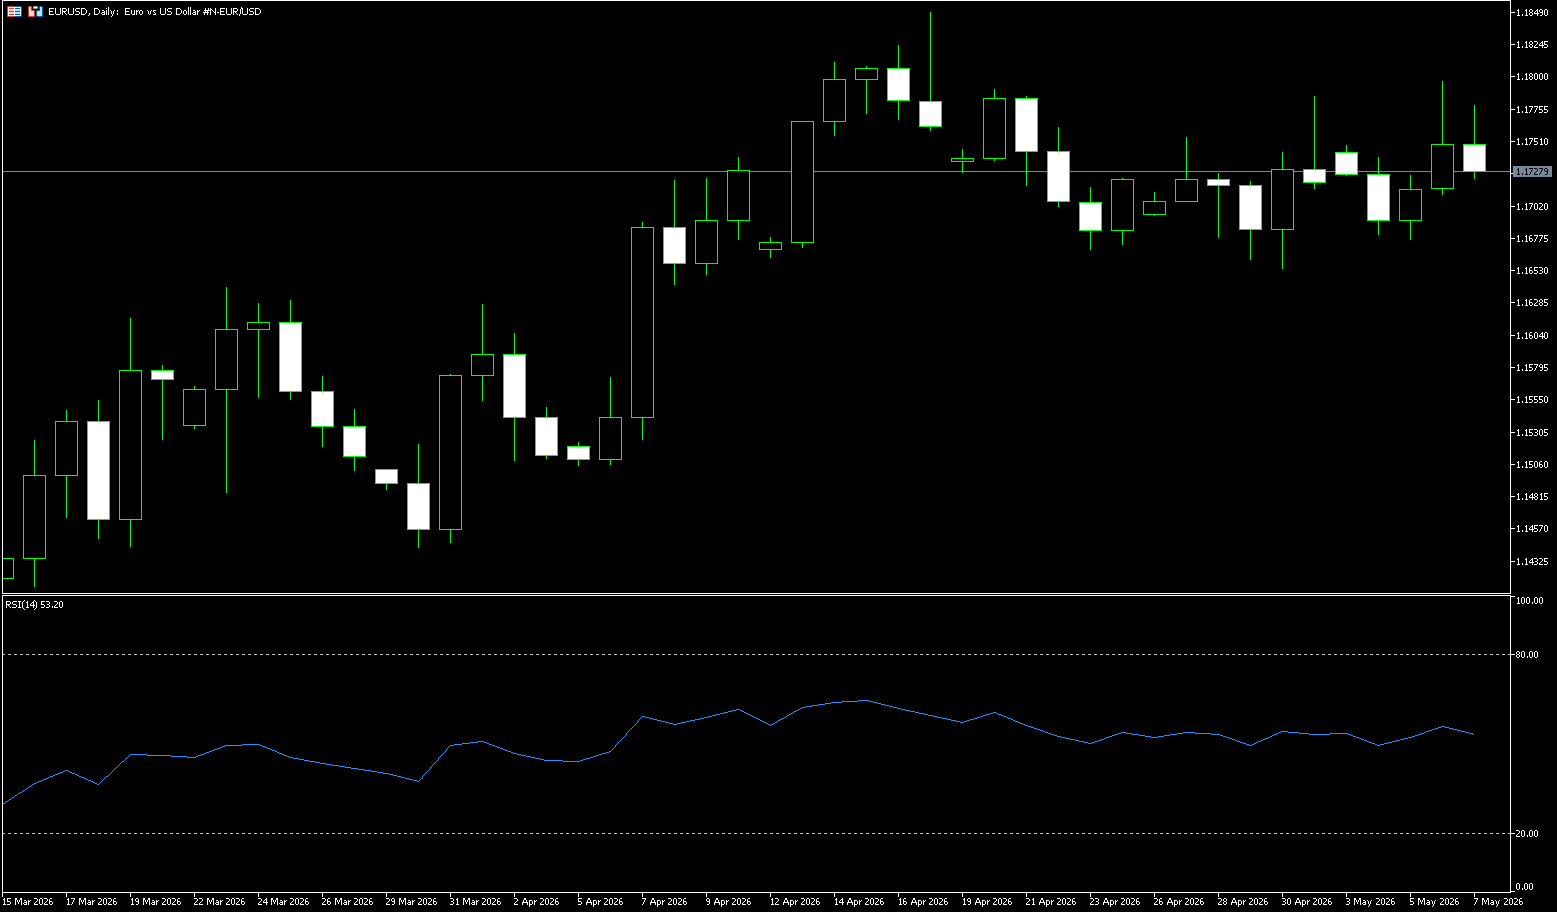
The euro/dollar pair traded in a narrow range around 1.1740 in early European trading on Thursday. The major currency pair consolidated as investors awaited Iran's response to the US's One Page peace plan, which restricts uranium enrichment in Tehran and reopens the Strait of Hormuz. Global markets remained risk-on overall, with Axios reporting that the US and Iran were close to reaching an agreement. S&P 500 futures were almost flat in European trading, but rose nearly 1.5% on Wednesday. The dollar index, which tracks the dollar's value against six major currencies, traded cautiously around 98.00. Looking ahead, investors will focus on Friday's release of the April US non-farm payroll (NFP) data. Investors will be closely watching this event for new clues about the outlook for Federal Reserve monetary policy.
The EUR/USD pair is trading steadily around 1.1740, maintaining a slight bullish bias as it remains above the 200-day simple moving average at 1.1680 and between key Fibonacci retracement levels of the latest wave. The pair is hovering slightly below the 50.0% retracement level at 1.1745, indicating that upward momentum has slowed but not yet reversed, while the 14-day Relative Strength Index (RSI) is around 56, suggesting constructive but not overextended upward momentum. On the upside, short-term resistance is at 1.1796 (Wednesday's high), followed by the 61.8% Fibonacci retracement level at 1.1825, with further resistance at the April high of 1.1850. Initial support is provided by the 1.1700 level, followed by the 200-day simple moving average at 1.1680 and the 38.2% Fibonacci retracement level at 1.1666.
Consider going long on the Euro today at 1.1716, with a stop-loss at 1.1705 and targets at 1.1760 and 1.1770.
Disclaimer: The information contained herein (1) is proprietary to BCR and/or its content providers; (2) may not be copied or distributed; (3) is not warranted to be accurate, complete or timely; and, (4) does not constitute advice or a recommendation by BCR or its content providers in respect of the investment in financial instruments. Neither BCR or its content providers are responsible for any damages or losses arising from any use of this information. Past performance is no guarantee of future results.
Lebih Liputan


Pendedahan Risiko:Instrumen derivatif diniagakan di luar bursa dengan margin, yang bermakna ia membawa tahap risiko yang tinggi dan terdapat kemungkinan anda boleh kehilangan seluruh pelaburan anda. Produk-produk ini tidak sesuai untuk semua pelabur. Pastikan anda memahami sepenuhnya risiko dan pertimbangkan dengan teliti keadaan kewangan dan pengalaman dagangan anda sebelum berdagang. Cari nasihat kewangan bebas jika perlu sebelum membuka akaun dengan BCR.
BCR Co Pty Ltd (No. Syarikat 1975046) ialah syarikat yang diperbadankan di bawah undang-undang British Virgin Islands, dengan pejabat berdaftar di Trident Chambers, Wickham’s Cay 1, Road Town, Tortola, British Virgin Islands, dan dilesenkan serta dikawal selia oleh Suruhanjaya Perkhidmatan Kewangan British Virgin Islands di bawah Lesen No. SIBA/L/19/1122.
Open Bridge Limited (No. Syarikat 16701394) ialah syarikat yang diperbadankan di bawah Akta Syarikat 2006 dan berdaftar di England dan Wales, dengan alamat berdaftar di Kemp House, 160 City Road, London, City Road, London, England, EC1V 2NX. Entiti ini bertindak semata-mata sebagai pemproses pembayaran dan tidak menyediakan sebarang perkhidmatan perdagangan atau pelaburan.

 English
 简体中文
简体中文
 繁體中文
繁體中文
 Bahasa
Melayu
Bahasa
Melayu
 Tiếng
Việt
Tiếng
Việt
 ไทย
ไทย
 日本語
日本語
 한국어
한국어
 ភាសាខ្មែរ
 español